Climate and weather at Higher Level: The same ideas as SL, with different places: Dubai's April 2024 storm, Mumbai's monsoon and Mount Kilimanjaro. Climate graphs come up in Paper 1 on both levels.
Practise this as you read
- Read every value with its units and its month.
- Compare two climates with numbers for each place.
Free preview
This is the free notes preview
You're reading the free notes. Aimnova Pro unlocks the full study experience — and you can try it with your first topic free to keep:
- FlashcardsLock in vocabulary and key terms with spaced repetition.
- Practice questionsAnswer exam-style questions and get instant AI marking.
- Mock exams & past-paper vaultSit full mocks and see exactly how examiners award marks.
- Personalised study planA daily plan built around your exam date and weak areas.
Two timescales: The weather changes from hour to hour. The climate is the long-term average that the weather varies around.
The points to remember
- Weather = the conditions in the atmosphere at one time, or over a short period (hours or days).
- Weather is described by temperature, humidity, air pressure and wind speed, plus rain and cloud.
- Climate = the average of those conditions over a long period: about 30 years.
- Climate tells you what to expect; weather is what you get on the day.
- One unusual day is weather. Biomes are shaped by climate, not by one day's weather.
Remember it as: Climate is what you expect; weather is what you get.
Weather
- A short period: now, today, this week
- Measured at a place and time
- Can change within hours
Climate
- A long period: about 30 years
- The average of many measurements
- Changes only slowly
Real example: on 16 April 2024 a storm dropped about 140 mm of rain on Dubai airport in one day and flooded the city. That was weather. Dubai's climate is desert: on average it gets under 100 mm a year.
Say how long: Put the time in every definition: weather is short-term; climate is the long-term average, about 30 years. 'Climate is the weather of a place' misses both the average and the time.
Get feedback like a real examiner
Submit your answers and get instant feedback — what you did well, what's missing, and exactly what to write to score full marks.
A climate graph shows a climate at a glance. Each value is an average of about 30 years.
How to read it
- Bars = mean monthly precipitation in mm, read on the left axis.
- Line = mean monthly temperature in °C, read on the right axis.
- Wettest or driest month: the tallest or shortest bar. Warmest month: the highest point.
- A range runs from the lowest value to the highest: 'from 5.8 to 19.3 °C'.
- Total annual precipitation = the 12 bars added together.
- Always give the units (°C, mm) and name the month.
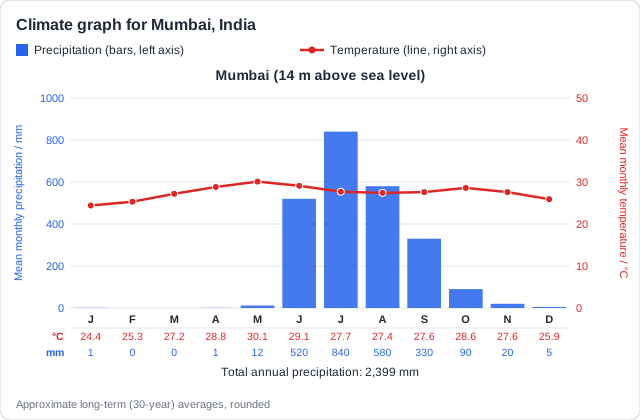
Real example: Mumbai gets 840 mm in July alone, and almost nothing from December to April: this is the monsoon. May is the warmest month (30.1 °C); monthly temperatures range from 24.4 to 30.1 °C.
A range has two ends: When asked for a range, give both ends with units: 'from 5.8 to 19.3 °C'. The difference alone (13.5 °C) is not always accepted; both ends always are. Read values carefully: a number close to the graph's is not enough.
Papers often give two climate graphs and ask you to compare or distinguish them. Build the answer from numbers, one place at a time.
How to compare two climates
- Compare precipitation: the yearly total, and when most of it falls.
- Compare temperature: the warmest and coldest months, and the annual range.
- Use comparing words: wetter, drier, warmer, a greater range.
- Quote numbers from the graph for both places.
- Make one point about each place: a mark is often kept for each one.
| Mumbai | Dubai | |
|---|---|---|
| Total precipitation | 2,399 mm | 94 mm |
| Wettest month | July, 840 mm | February, 25 mm |
| Warmest month | May, 30.1 °C | August, 36.2 °C |
| Coldest month | January, 24.4 °C | January, 19.7 °C |
| Annual temperature range | 5.7 °C | 16.5 °C |
Real example: Mumbai's rain comes almost all in four monsoon months. Dubai, in the desert, gets less than a twentieth of Mumbai's rain and is hotter in summer, with a much greater temperature range.
Compare, do not just describe: 'Dubai is hot and dry' describes one place. Write 'Dubai gets 94 mm a year, far less than Mumbai's 2,399 mm'. 'Warmer' or 'drier' alone, with no numbers, is not enough.
Learn what examiners really want
See exactly what to write to score full marks. Our AI shows you model answers and the key phrases examiners look for.
Climate also changes with height. Air gets thinner and colder as you climb, so mountains have cooler climates than the lowlands around them.
The points to remember
- Temperature falls as altitude rises: about 6.5 °C for every 1,000 m.
- So one mountain can run from subtropical at its foot to alpine (cold) at the top.
- Precipitation changes with height too: slopes facing the rain-bearing wind are wetter.
- On two maps, state the relationship: 'as elevation increases, temperature decreases'.
Remember it as: Up 1,000 m, down about 6.5 °C.
Real example: at the foot of Mount Kilimanjaro, Tanzania, the town of Moshi (about 800 m) averages about 23 °C. The summit, 5,895 m high, is below freezing for most of the year and still has glaciers.
State the pattern: With an elevation map and a climate map, one sentence earns the mark: 'as elevation increases, the climate becomes colder, from subtropical in the valleys to alpine on the peaks'. Naming one zone's height is not a pattern.
How this comes up: Paper 1, question 1: two climate graphs from the resource booklet. Distinguish between the two climates [2].
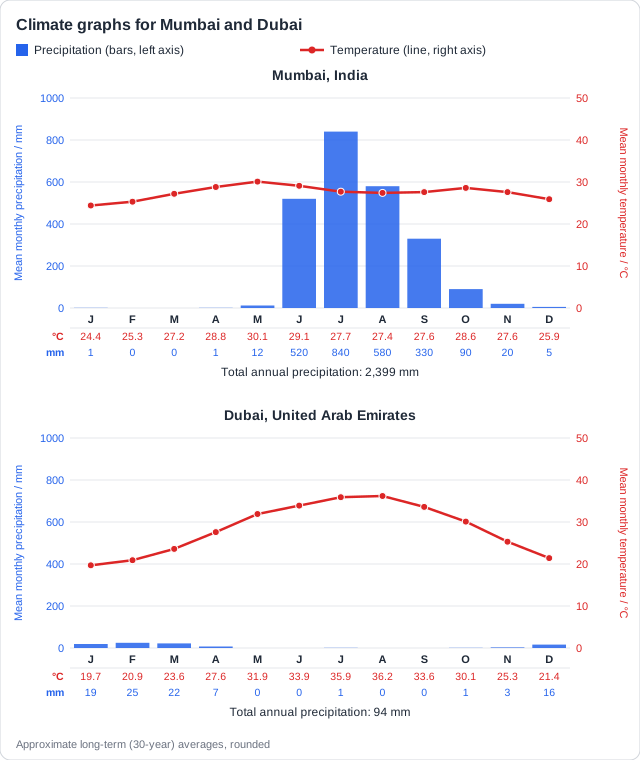
Figure 1 shows climate graphs for Mumbai, India, and Dubai, United Arab Emirates.
With reference to Figure 1, distinguish between the climates of Mumbai and Dubai.
Model answer plan
See the mark-by-mark plan — for / against / judgement, with marking guidance — in study mode.