Ecological pyramids at Higher Level: The same ideas as SL, with different examples: sheep ticks, the open ocean, Cedar Bog Lake and the Serengeti. At HL, expect to judge pyramids as models, for example the disadvantages of a pyramid of biomass.
Practise this as you read
- Draw a pyramid from data or from a food web, with named species.
- Judge each pyramid as a model: what it shows and misses.
Free preview
This is the free notes preview
You're reading the free notes. Aimnova Pro unlocks the full study experience — and you can try it with your first topic free to keep:
- FlashcardsLock in vocabulary and key terms with spaced repetition.
- Practice questionsAnswer exam-style questions and get instant AI marking.
- Mock exams & past-paper vaultSit full mocks and see exactly how examiners award marks.
- Personalised study planA daily plan built around your exam date and weak areas.
A food chain, stacked up: An ecological pyramid shows how much there is at each trophic level. Producers go at the bottom; each level up is a wider or narrower bar, so you see how energy and matter change up a food chain.
The points to remember
- An ecological pyramid shows one bar per trophic level, producers at the bottom.
- The width of each bar shows the amount at that level.
- Three kinds: numbers, biomass and energy (also called productivity).
- Numbers and biomass show the standing crop per area at one time.
- Energy shows the energy flowing to each level per area per year: kJ m⁻² yr⁻¹.
Remember it as: Numbers count, biomass weighs, energy flows.
| Pyramid | What it shows | Units |
|---|---|---|
| Numbers | How many individuals, at one time | individuals per m² (or per area) |
| Biomass | Dry mass of living things, at one time | g m⁻² |
| Energy | Energy flowing in, over a year | kJ m⁻² yr⁻¹ |
Real example: at Cedar Bog Lake in Minnesota, one of the first studies of a whole ecosystem measured the energy reaching algae, water fleas and predatory fish in 1942.
Know your predicted grade
Take timed mock exams and get detailed feedback on every answer. See exactly where you're losing marks.
A pyramid of numbers is the standing crop counted: how many individuals live at each level in one area, at one time.
The points to remember
- A pyramid of numbers counts individuals at each trophic level per area.
- It is usually upright: fewer animals at each level up.
- It is inverted when the producer is one big organism, such as one oak tree.
- Parasites make it wider at the top: one host carries many parasites.
- It ignores size: an oak tree and a greenfly each count as one.
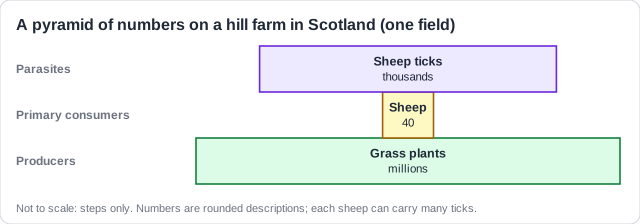
Real example: on hill farms in Scotland, each sheep can carry many sheep ticks, so the parasites outnumber their hosts.
Numbers say nothing about size: A pyramid of numbers counts one oak tree and one greenfly the same. That is why it can be inverted, and why it tells you little about energy.
A pyramid of biomass weighs the standing crop instead of counting it. It uses dry mass per square metre.
The points to remember
- A pyramid of biomass shows the dry mass of living things at each level, in g m⁻².
- It is the standing crop at one time: a snapshot, not a rate.
- On land it is usually upright: plants far outweigh the animals.
- In water it can be inverted: phytoplankton reproduce and are eaten so fast that little is there at once.
- It changes with the season, so one sample can mislead.
- It shows the energy stored more truly than numbers do, because it weighs each organism.
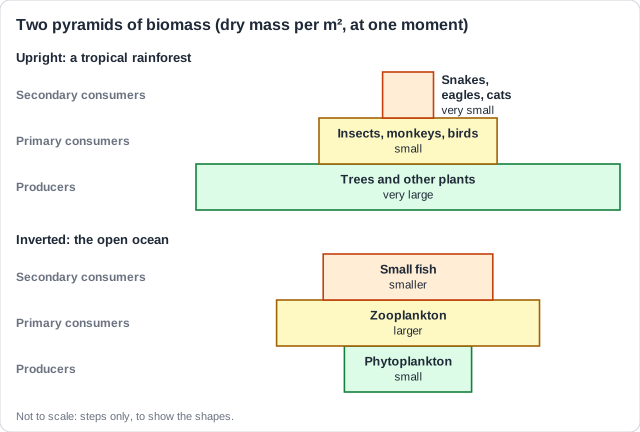
Real example: in the open ocean, phytoplankton can divide about once a day, so a small stock feeds a larger mass of zooplankton.
How biomass is measured: Plant samples are dried to a constant mass (water is removed because its amount varies and it holds no energy), and burned to find their energy, then scaled up to the whole area. The full method is on the next page, 2.2.16.
Get feedback like a real examiner
Submit your answers and get instant feedback — what you did well, what's missing, and exactly what to write to score full marks.
A pyramid of energy measures a flow, not a stock: how much energy passes into each level over a year.
The points to remember
- A pyramid of energy shows the energy flowing to each level per area per year: kJ m⁻² yr⁻¹.
- Energy is lost at every transfer, mostly as heat from respiration.
- So each bar is smaller than the one below: often about a tenth.
- It is never inverted: this follows from the second law of thermodynamics.
- It is the most accurate pyramid: it shows the real energy losses.
- It is also called a pyramid of productivity.
Remember it as: Energy is lost at every step, so the pyramid never turns over.
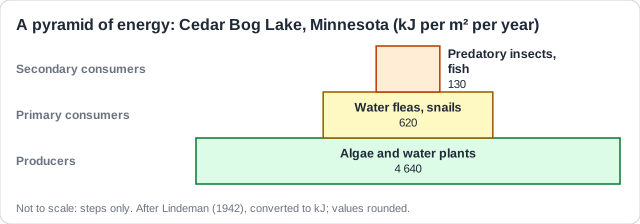
Real example: at Cedar Bog Lake, the algae took in about 4 640 kJ per m² per year, and only about 130 reached the predatory insects and fish.
Why the loss happens: Most energy is used in respiration and lost as heat, or never eaten. That story is 2.2.12 and 2.2.14; here you only need the shape it gives.
The three pyramids of one food chain can look very different. Each shape has a reason you can explain.
The points to remember
- Energy pyramids get smaller at higher levels, because energy is lost at each transfer.
- A low level can look small in one season, but over a whole year energy still falls.
- Numbers get larger higher up if the lower organisms are big (trees) or if the top ones are parasites.
- Biomass can be inverted: it shows the standing stock, not the rate of flow.
- A single chain cut from a bigger food web can widen higher up: food comes in from other chains.
- More trophic levels make a taller pyramid.
| Pyramid | Usual shape | Can it be inverted? | Why |
|---|---|---|---|
| Numbers | Upright | Yes | Big producers (trees) or parasites |
| Biomass | Upright on land | Yes, in water | A snapshot of fast-turnover producers |
| Energy | Upright | Never | Energy is lost at every transfer |
Real example: on a Scottish hill farm the pyramid of numbers is wide at the top with ticks, but the pyramid of energy for grass, sheep and ticks still narrows at every level.
Say HOW the shape changes: 'The shape is different' gains nothing. Say which bar is larger or smaller, and why: 'the producer bar is narrower because one oak tree feeds thousands of caterpillars'. And name the right pyramid: 'more energy in the producers' explains an energy pyramid, not a pyramid of numbers.
Learn what examiners really want
See exactly what to write to score full marks. Our AI shows you model answers and the key phrases examiners look for.
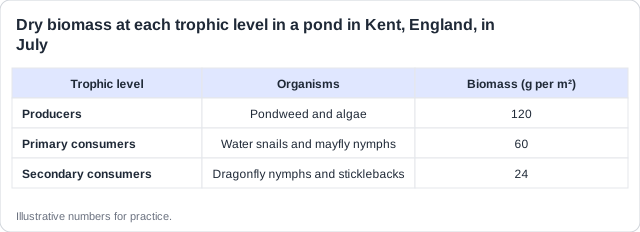
A common task is to draw a pyramid from a table of data. Follow the same five steps every time.
Order
Producers at the bottom, then each trophic level in order.
Scale
Choose a width for the largest value; scale the others to it.
Draw
One horizontal bar per level, centred on the one below.
Label
Trophic level, named organisms, value and units on every bar.
Title
Say which kind of pyramid, which place and which units.
The points to remember
- Put the producers at the bottom, then each trophic level above in order.
- Draw one horizontal bar per level, centred, width set by the value.
- Draw to scale if you can; if each level is a tenth of the last, draw clear steps.
- Label each bar: trophic level, named organisms and the value with units.
- Numbers: individuals per area. Biomass: g m⁻². Energy: kJ m⁻² yr⁻¹.
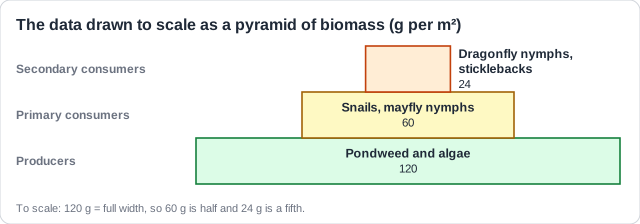
A drawing checklist: Sticklebacks eat the nymphs, so they share the third bar. Check every bar has a name, a number and units.
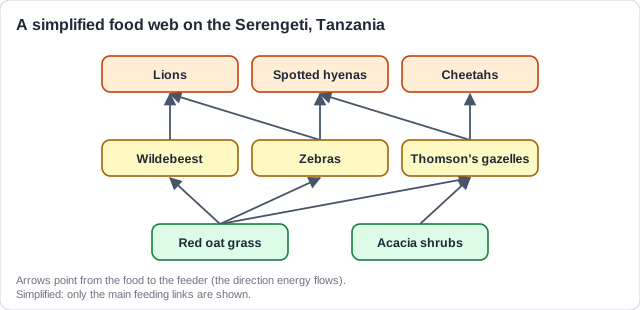
Sometimes you get a food web, not numbers, and must turn it into a pyramid of energy. Place each species on its level, then draw clear steps.
The points to remember
- Give each species its trophic level from the food web.
- Put named species on each step, not 'plants' or 'birds'.
- To draw it with numbers you need the energy flowing into each level, not just 'energy'.
- You also need the study area (per m²) and the time period (one year).
- With one level known, the 10% rule estimates the next.
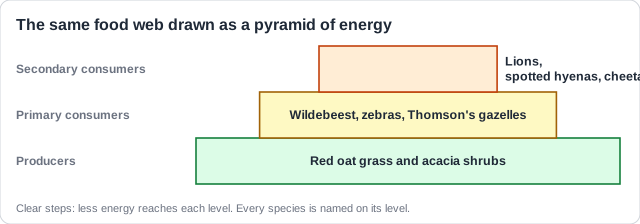
Two traps: A food chain with arrows is not a pyramid: draw stacked bars. And name the species: 'spotted hyenas', not 'predators'.
Never wonder what to study next
Get a personalized daily plan based on your exam date, progress, and weak areas. We'll tell you exactly what to review each day.
Pyramids are models (see 1.2.14). Like every model, they help, but they leave things out.
The points to remember
- Strength: a pyramid of energy shows the flow over time, not a snapshot, and is never inverted.
- Strength: it lets you compare ecosystems and communicates simply; it can help predict.
- Limit: organisms that feed at more than one level are hard to place.
- Limit: data are hard to collect and approximate; sampling may mean killing organisms.
- Limit: a biomass pyramid is one moment: it misses seasons and energy flow.
- Limit: every pyramid is a model: it oversimplifies the real food web.
Strengths
- Energy: shows flow over time
- Energy: never inverted
- Easy to compare ecosystems
- Simple picture anyone can read
Limits
- Omnivores fit more than one level
- Data are hard to collect
- Sampling may kill organisms
- Biomass: one moment, no seasons
Real example: to weigh the fish of a lake, scientists often have to catch and kill samples, which some people see as unethical, especially for rare species.
One of each: When asked for a strength and a weakness, give one clear point on each side. Two strengths score only once.
How this comes up: Paper 2, Section A: a food chain with pollutant data, then suggest two disadvantages of a pyramid of biomass [2].
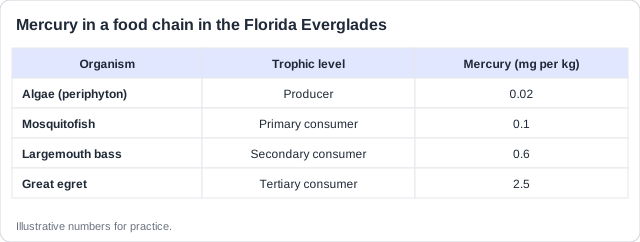
Figure 1 shows the mercury found in a food chain in the Florida Everglades.
Suggest two disadvantages of using a pyramid to represent the biomass of organisms in this food chain.
Model answer plan
See the mark-by-mark plan — for / against / judgement, with marking guidance — in study mode.