Short food chains at Higher Level: The same idea as SL, with different real cases: Cedar Bog Lake in Minnesota and the polar bears of the Arctic. At HL the efficiency you calculate here is called ecological efficiency (2.2.28).
Practise this as you read
- Calculate the efficiency of transfer, formula first.
- Explain the limit on trophic levels with data.
Free preview
This is the free notes preview
You're reading the free notes. Aimnova Pro unlocks the full study experience — and you can try it with your first topic free to keep:
- FlashcardsLock in vocabulary and key terms with spaced repetition.
- Practice questionsAnswer exam-style questions and get instant AI marking.
- Mock exams & past-paper vaultSit full mocks and see exactly how examiners award marks.
- Personalised study planA daily plan built around your exam date and weak areas.
Energy runs out: Energy is lost at every trophic level. Only a small share passes on, so after a few steps there is not enough left to feed another level.
The points to remember
- At every level, energy is released by cellular respiration and lost as heat.
- Heat cannot be used by the next level: it is unavailable to higher trophic levels.
- So typically 10% or less of the energy reaching one level passes on to the next.
- After four or five levels, too little energy is left to support another population.
- That is why food chains are short.
Remember it as: Ten per cent passes on; the rest is heat.
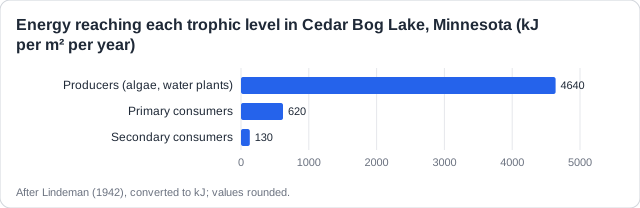
Real example: in 1942 Raymond Lindeman measured energy flow in Cedar Bog Lake, a small lake in Minnesota, USA. Only three trophic levels could be supported, and the third received about 130 kJ per m² per year, less than 3% of what the producers captured.
Where the other 90% goes: Not all food is eaten, not all eaten food is absorbed, and cellular respiration turns much of the rest into heat. The full list of losses is on the page for 2.2.12.
Practice with real exam questions
Answer exam-style questions and get AI feedback that shows you exactly what examiners want to see in a full-marks response.
Because so little energy reaches the top, the animals there are few, and each one needs a large area. An apex predator is rare for this reason.
What it means for top predators
- Less energy reaches each higher level, so top predators are few in number.
- They are usually large and need large areas to find enough prey.
- Few, spread-out animals are easily harmed: top predators are often endangered.
- The reason is less energy flowing in, not that they eat more food.
Remember it as: Top of the chain: few, big, far apart.
Real example: only about 26 000 polar bears live across the whole Arctic, and a single bear can roam tens of thousands of square kilometres of sea ice hunting seals.
A common wrong answer: Do not say that animals higher up 'must eat more food to get enough energy'. The limit is that less energy flows into each higher level, so fewer animals can be supported there.
The formula: Efficiency of transfer (%) = (energy in the higher trophic level ÷ energy in the lower trophic level) × 100
How to use it
- Efficiency (%) = (energy in the higher level ÷ energy in the lower level) × 100.
- Put the higher (later) level on top of the fraction.
- Use the same units for both levels, e.g. kJ per m² per year.
- The answer is a percentage, always below 100%, usually about 5-20%.
- Show your working: formula, numbers, answer.
Worked example: Worked example (Cedar Bog Lake): producers captured 4 640 kJ per m² per year; primary consumers received 620.
Efficiency = (620 ÷ 4 640) × 100 = 13.4%.
At HL this percentage has a name, ecological efficiency (2.2.28).
Check your answer: An answer above 100% means the fraction is upside down. Divide the smaller, higher level by the larger, lower level: higher over lower, times one hundred.
Feeling unprepared for exams?
Get a clear study plan, practice with real questions, and know exactly where you stand before exam day. No more guessing.
How this comes up: Paper 2, Section A: energy data for a food chain. Calculate an efficiency [1], then explain the limit on trophic levels [2-3].
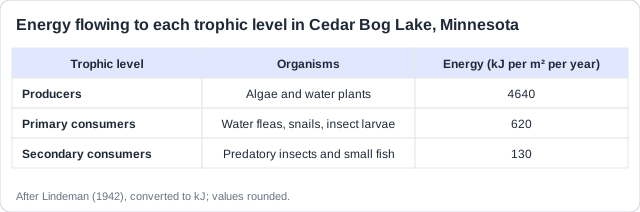
Figure 1 shows the energy flowing to each trophic level in Cedar Bog Lake, Minnesota.
Using Figure 1, explain why the lake could not support a fourth trophic level of large predatory fish.
Model answer plan
See the mark-by-mark plan — for / against / judgement, with marking guidance — in study mode.