Biosphere integrity at Higher Level: The same boundary as SL, with different evidence: Germany's vanishing insects, Latin America's wildlife, and both of the measures scientists use for this boundary.
Practise this as you read
- Name both parts: genetic and functional diversity.
- Quote each measured value against its boundary.
Free preview
This is the free notes preview
You're reading the free notes. Aimnova Pro unlocks the full study experience — and you can try it with your first topic free to keep:
- FlashcardsLock in vocabulary and key terms with spaced repetition.
- Practice questionsAnswer exam-style questions and get instant AI marking.
- Mock exams & past-paper vaultSit full mocks and see exactly how examiners award marks.
- Personalised study planA daily plan built around your exam date and weak areas.
One boundary, looked at closely: The planetary boundaries model shows that biosphere integrity has passed a critical threshold. It is one of the boundaries furthest beyond its safe limit.
The points to remember
- Biosphere integrity is the health of the living world: all its species and ecosystems.
- It has two parts: genetic diversity (the variety of genes and species) and functional diversity (the jobs species do).
- Ecosystems and species depend on each other: ecosystems support species, and species keep ecosystems working.
- So when an ecosystem is disturbed, species are lost; and when species are lost, the ecosystem works less well.
Remember it as: Species hold up ecosystems; ecosystems hold up species.
Real example: in nature reserves in Germany, the weight of flying insects caught in traps fell by 76% over 27 years (1989-2016). Fewer insects means less pollination, less food for birds and slower decomposition.
Genetic diversity
- The variety of genes and species
- Measured by the extinction rate
- Lost when species die out
Functional diversity
- The jobs species do
- Pollinating, decomposing, grazing
- Lost when those jobs stop
Stop wasting time on topics you know
Our AI identifies your weak areas and focuses your study time where it matters. No more overstudying easy topics.
Human activity has disturbed ecosystems on every continent and in every ocean, and this is what has worn down biosphere integrity.
How human activity erodes it
- Habitat loss: forests, wetlands and grasslands turned into farms, cities and roads (the biggest cause).
- Overexploitation: overfishing, hunting and logging faster than species can recover.
- Climate change: species cannot move or adapt fast enough.
- Pollution: pesticides, fertiliser and plastics.
- Invasive species: rats, cats and other species brought in by people.
Remember it as: Habitat, harvest, heat, poison, invaders.
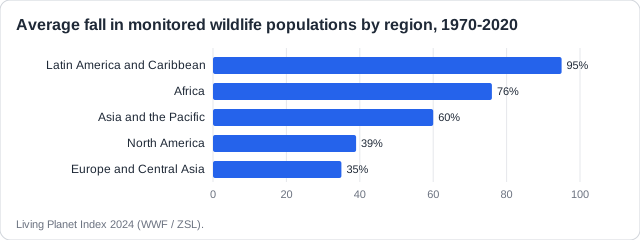
Real example: in Latin America and the Caribbean, monitored wildlife fell by 95% on average between 1970 and 2020, mainly as forests and grasslands were cleared for cattle and crops.
An average fall, not a count: A 73% fall means monitored populations are, on average, about a quarter of their 1970 size. It does not mean 73% of all animals, or 73% of species, have gone.
How do we know the boundary has been crossed? The clearest evidence is the extinction rate.
The points to remember
- Before humans, about 1 extinction per million species per year (the background rate).
- The planetary boundary is 10 extinctions per million species per year.
- Today's rate is over 100: more than ten times the boundary.
- So the boundary for biosphere integrity has been crossed, and it is in the high-risk zone.
Remember it as: Background 1, boundary 10, today over 100.
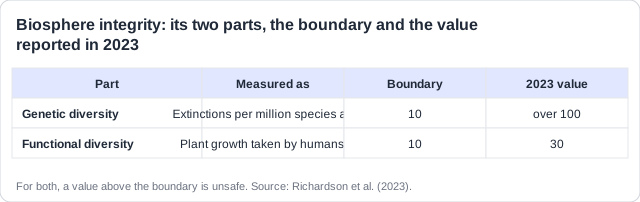
Functional diversity is measured by how much of the plants' yearly growth humans take for food, timber and fuel. The boundary is 10%; humans now take about 30%, so less is left to feed the rest of life.
Real example: a 2023 update of the model by Richardson and colleagues judged both parts of biosphere integrity to be well beyond their boundaries, in the high-risk zone.
A rate, not a total: Quote the extinction rate with its unit, 'per million species per year', and compare it with the boundary of 10.
See how examiners mark answers
Access past paper questions with model answers. Learn exactly what earns marks and what doesn't.
How this comes up: Paper 2, Section A: a table of boundary data; explain why a boundary is judged crossed [3].
Figure 1 shows the boundary and the value reported in 2023 for the two parts of biosphere integrity.
Explain why the planetary boundary for biosphere integrity is judged to have been crossed.
Model answer plan
See the mark-by-mark plan — for / against / judgement, with marking guidance — in study mode.