Random quadrat sampling at Higher Level: The same methods as SL, with different real cases: limpets on a rocky shore, shore surveys, and plants in front of a glacier.
Practise this as you read
- Calculate density from quadrats of any size.
- Describe a transect survey step by step.
Free preview
This is the free notes preview
You're reading the free notes. Aimnova Pro unlocks the full study experience — and you can try it with your first topic free to keep:
- FlashcardsLock in vocabulary and key terms with spaced repetition.
- Practice questionsAnswer exam-style questions and get instant AI marking.
- Mock exams & past-paper vaultSit full mocks and see exactly how examiners award marks.
- Personalised study planA daily plan built around your exam date and weak areas.
Random spots, count, scale up: For non-mobile organisms, count them in quadrats placed at random, then scale up.
The points to remember
- Mark the area out as a grid and pick coordinates with random numbers.
- Place a quadrat at each point and count the individuals inside it.
- Take enough quadrats (often 10 or more) and find the mean per quadrat.
- Population density = mean per quadrat ÷ area of one quadrat (individuals per m²).
- Population size = density × total area of the habitat.
- Choose a quadrat size to suit the organism: 0.25 m² for small plants, bigger for shrubs.
Worked example: Twelve 0.25 m² quadrats on a rocky shore hold 48 limpets. Mean = 4 per quadrat, so density = 4 ÷ 0.25 = 16 per m². The shore is 350 m², so population ≈ 16 × 350 = 5600 limpets.
Real example: on rocky shores around Britain, the MarClim surveys count barnacles and limpets to track how warming seas change which species live there.
Remember it as: Random spot, count, find the mean, multiply by the area.
Learn what examiners really want
See exactly what to write to score full marks. Our AI shows you model answers and the key phrases examiners look for.
Counting works for separate plants. For grass, moss or seaweed, measure how much there is instead.
Three ways to measure abundance
- Density: the number of individuals per unit area, e.g. 16 limpets per m².
- Percentage cover: the % of the quadrat's area covered by the species; used when plants cannot be counted.
- Percentage frequency: occurrences ÷ possible occurrences × 100: in 5 of 100 squares = 5%.
- Cover and frequency give abundance, but not the actual population size.
Remember it as: Cover: how much space. Frequency: how many squares.
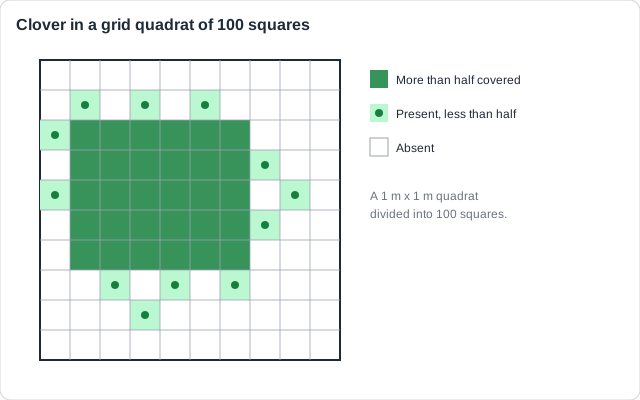
In the grid, 30 of the 100 squares are more than half covered: cover = 30%. Clover is present in 30 + 12 = 42 squares: frequency = 42%.
Not population size: A single spreading plant can fill many squares, so cover and frequency show abundance, not the number of plants.
Measuring change along a transect: To see how plants change across a habitat, combine a transect with quadrats.
The points to remember
- Lay a transect in a straight line across the gradient, e.g. outwards from a glacier's end.
- Sample at regular intervals along it (systematic sampling), e.g. every 50 m.
- At each point, place a quadrat, at random close to the point, to avoid bias.
- Estimate percentage cover (count the squares covered) or frequency in each quadrat.
- Repeat with several parallel transects and find the mean at each distance.
Remember it as: Line, regular points, a quadrat at each, cover, repeat.
Real example: in front of the shrinking Rhone Glacier in Switzerland, plant cover rises with distance from the ice, because ground further away has been free of ice for longer.
Describe the whole method: 'Systematic sampling' on its own is not a method: say where the transect goes, how the quadrats are placed, and what you record.
Never wonder what to study next
Get a personalized daily plan based on your exam date, progress, and weak areas. We'll tell you exactly what to review each day.
Quadrats are simple and cheap, but they have limits.
The points to remember
- Works only for non-mobile or very slow organisms: plants, barnacles, limpets.
- Cover estimates are subjective: two people may give different values.
- Too few or too small quadrats miss rare or clumped species.
- Plants that spread, such as grass, cannot be counted: use cover instead.
- Results are estimates: repeat and average to make them more reliable.
Remember it as: Still, subjective, enough, cover for grass, repeat.
Real example: limpets move slowly and return to the same spot, so quadrats work; crabs on the same shore move too fast and need mark-recapture instead.
How this comes up: Paper 1 or Section A: describe how percentage cover data were collected [3], or calculate density, a population estimate or percentage frequency from quadrat counts [1-2].
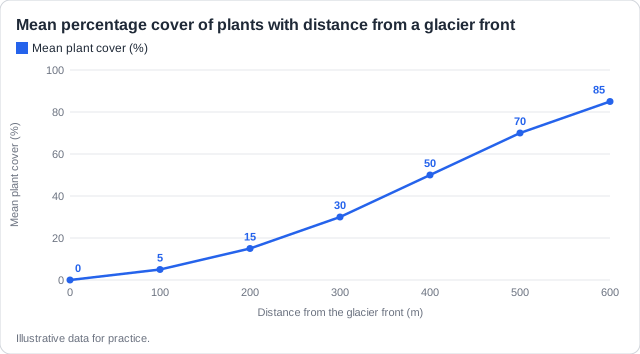
Ecologists measured how plant cover changes with distance from a glacier front, as shown in the graph above.
Describe a method used to collect the data on percentage cover shown in the graph.
Model answer plan
See the mark-by-mark plan — for / against / judgement, with marking guidance — in study mode.