Three places to act: Air pollution can be managed where it starts (the activity), where it escapes (the release) or where it does harm (the impact). The pollution management model puts these in order.
The three levels
- Level 1, change the activity: burn less fuel: public transport, cycling, renewable energy, efficient homes.
- Level 2, control the release: catalytic converters, scrubbers, emission laws, low emission zones.
- Level 3, clean up and restore: trees and green spaces, health care, warnings, cleaning buildings, liming acid ponds.
- Level 1 stops pollution at its source, but needs money and behaviour change.
- Level 2 is effective and easy to enforce, but people keep burning fuel, and rich firms may just pay fines.
- Level 3 is short-term and can be costly: it treats the damage, not the cause.
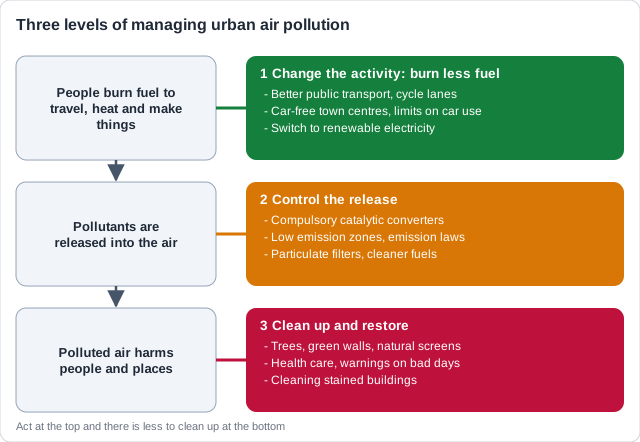
Real example: Delhi acts at all three levels. Its metro (level 1) cuts car trips; since about 2002 its buses and auto-rickshaws run on CNG (level 2); and in 2021 it opened a 'smog tower' that filters the air of one busy square (level 3).
Free preview
This is the free notes preview
You're reading the free notes. Aimnova Pro unlocks the full study experience — and you can try it with your first topic free to keep:
- FlashcardsLock in vocabulary and key terms with spaced repetition.
- Practice questionsAnswer exam-style questions and get instant AI marking.
- Mock exams & past-paper vaultSit full mocks and see exactly how examiners award marks.
- Personalised study planA daily plan built around your exam date and weak areas.
The most sustainable strategies change how people move, so less fuel is burned in the first place. This is level 1.
Changing how people travel
- Improved public transport: metros, trams and fast bus lanes carry many people for little fuel each.
- Infrastructure for cycling: safe, separate cycle lanes and bike-sharing schemes.
- Limited car use: driving bans by number plate, car-free days, caps on new cars.
- Pedestrianised town centres: streets closed to traffic, so no exhaust where people walk.
- Planning: homes, jobs and shops close together, so trips are short; working from home.
- Campaigns: car sharing, walking to school, and travel advice on high-pollution days.
Better options
- Metros, trams, bus lanes
- Protected cycle lanes
- Bike-sharing schemes
Fewer cars
- Driving bans by number plate
- Car-free days
- Caps on new cars
Car-free places
- Pedestrianised centres
- School streets
- Mixed-use neighbourhoods
Reading a transport graph: Car use rises with incomes and status, and falls with caps, charges and better public transport. Cycling rises with safe lanes and subsidies; it falls as roads get busier and people can afford cars.
Real example: since 1974, Bogotá, Colombia, has closed about 120 km of its main roads to cars every Sunday and public holiday for the Ciclovía. Over a million people cycle, run or walk there each week.
A ban needs an alternative: Limiting cars works only if people have another way to travel. Without good public transport, people find a way round the rule.
Memorize terms 3x faster
Smart flashcards show you cards right before you forget them. Perfect for definitions and key concepts.
Laws, charges and money can make polluting more expensive and cleaner choices cheaper. They act at levels 1 and 2.
Laws, zones and charges
- Low emission zones: older, dirtier vehicles pay or are banned in part of the city.
- Congestion charges: drivers pay to enter the centre (London, Singapore, Stockholm).
- Standards: limits on what vehicles and factories may emit; air-quality targets (WHO).
- Cleaner fuel rules: low-sulfur fuel, leaded petrol banned.
- Money: pollution taxes, subsidies for electric vehicles and renewables, scrappage of old cars, cap and trade.
- Agreements with neighbouring regions or countries for pollution that crosses borders.
- Laws only work if they are enforced and people have alternatives.
Congestion charge
- Pay to drive into the centre
- Cuts the number of vehicles
- Money can fund buses
Low emission zone
- Older, dirtier vehicles pay or are banned
- Cuts the dirtiest exhausts
- Pushes people to cleaner cars
Real example: London began a congestion charge in 2003; traffic entering the zone fell by about a fifth. In 2019 it added an Ultra Low Emission Zone, extended to all of London in 2023. City Hall estimates roadside NO₂ in the centre is close to half what it would have been.
Technology can clean up exhausts and chimneys without anyone changing their habits. This is mostly level 2, controlling the release.
Technology at the source
- Compulsory catalytic converters: turn CO, NOₓ and hydrocarbons into CO₂, nitrogen and water.
- Particulate filters trap soot from diesel exhausts.
- Electric, hybrid and hydrogen vehicles: no or less exhaust; but the electricity's source matters.
- Industry: scrubbers spray lime and water to remove SO₂; electrostatic precipitators remove particles.
- Fuel switching: coal to gas or renewables; at home, clean cookstoves, heat pumps, insulation.
- Technology is fast, but costly, and more cars can cancel out cleaner engines.
- For ozone, cut VOCs as well as NOₓ: car sharing, fewer solvent-based paints, less livestock methane.
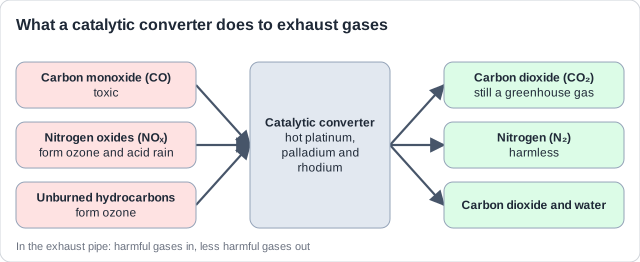
Real example: since 1993 every new petrol car sold in the European Union has had to carry a catalytic converter. Converters and later diesel particulate filters cut what each new car releases many times over.
Limits of the technology: Catalytic converters cost money, still release carbon dioxide, and use rare metals (platinum, palladium, rhodium) that are mined and often stolen. Electric vehicles need charging points, and their electricity may come from coal.
Know your predicted grade
Take timed mock exams and get detailed feedback on every answer. See exactly where you're losing marks.
Plants can clean some of the air once it is polluted, and they make cities nicer to live in. This is mostly level 3, clean-up.
Green solutions
- Growing trees: leaves trap particles and take up some gases; shade cools streets.
- Natural screens: hedges between a busy road and a school or pavement block some fumes.
- Green walls and roofs: plants on buildings, where there is no room for trees.
- They also cool the city, hold rainwater and give wildlife a home.
- Limits: they clean only a little air; a dense canopy in a narrow street can trap exhaust; some trees release VOCs.
- Planning rules can require greenery: Singapore makes new buildings replace the green space they cover.
Remember it as: Trees help, but no city can plant its way out of its traffic.
Real example: Milan's Bosco Verticale opened in 2014. Hundreds of trees and thousands of shrubs grow on the balconies of two tower blocks, trapping dust and shading the flats.
Do not overclaim: Trees and green walls clean only a small share of a city's air. In an evaluation, say so: they treat the symptom, not the cause.
Many questions ask you to evaluate a strategy, or to judge one approach against another. Use the same checklist every time, and finish with a judgement.
Judging a strategy
- Effectiveness: how much does pollution fall, and does it just move elsewhere?
- Cost: who pays: the government, drivers, companies?
- Equity: does it fall hardest on poorer people?
- Enforcement and support: can it be policed, and will people accept it?
- Values: technocentric people trust technology; anthropocentric people trust laws and planning; ecocentric people want less consumption.
- Percentage change = (new - old) / old x 100: Beijing (58 - 89.5) / 89.5 x 100 = -35 %.
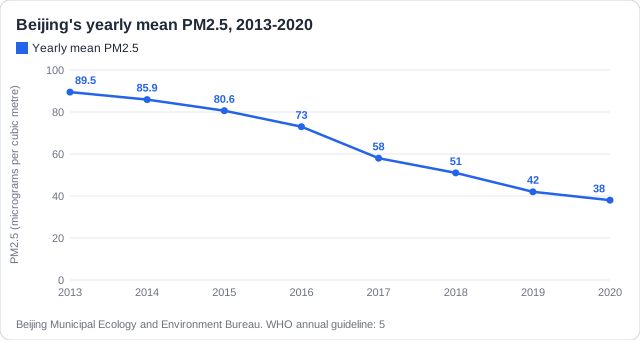
Real example: Beijing's Clean Air Action Plan (2013-2017) replaced coal heating with gas and electricity, closed or moved polluting factories, scrapped old vehicles and capped new cars. PM2.5 fell from 89.5 to 58 micrograms per m³ (-35 %), but stayed over ten times the WHO guideline, and summer ozone rose.
Get feedback like a real examiner
Submit your answers and get instant feedback — what you did well, what's missing, and exactly what to write to score full marks.
How this comes up: Paper 2, Section B part (b) [7]: strategies at the three levels, each with a strength or weakness. Strategies with no evaluation cap you at 4.
Mumbai, India, has over 20 million people in its wider region, and its air is often polluted by traffic, industry and building sites.
Evaluate urban air pollution management strategies at the three levels of intervention.
Model answer plan
See the mark-by-mark plan — for / against / judgement, with marking guidance — in study mode.