Deaths fall first, then births: The demographic transition model (DTM) shows how a country's births and deaths change as it develops. Deaths fall first and births follow, so the population grows fast in the middle stages and levels off at the end.
The five stages
- Stage 1, high stationary: high birth and death rates; the population stays small.
- Stage 2, early expanding: the death rate falls; the birth rate stays high; growth is fastest.
- Stage 3, late expanding: the birth rate falls; the death rate keeps falling; growth slows.
- Stage 4, low stationary: low birth and death rates; the population is large and stable.
- Stage 5, declining: the birth rate drops below the death rate; the population ages and may shrink.
- Total population grows exponentially in stages 2-3, stabilises in stage 4, may decline in 5.
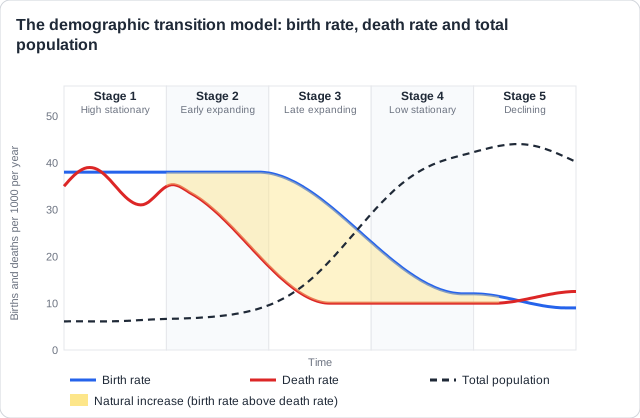
Remember it as: Both high; deaths fall; births fall; both low; births below deaths.
Real example: England and Wales went through the stages. Deaths began to fall from about the 1750s (stage 2), births from about the 1870s (stage 3), and by the mid-20th century both were low (stage 4).
Free preview
This is the free notes preview
You're reading the free notes. Aimnova Pro unlocks the full study experience — and you can try it with your first topic free to keep:
- FlashcardsLock in vocabulary and key terms with spaced repetition.
- Practice questionsAnswer exam-style questions and get instant AI marking.
- Mock exams & past-paper vaultSit full mocks and see exactly how examiners award marks.
- Personalised study planA daily plan built around your exam date and weak areas.
In stage 2 people stop dying young, but families still have many children. The gap between births and deaths, the natural increase, is at its widest.
Why the death rate falls, and births stay high
- Clean water and sanitation stop diseases such as cholera and typhoid spreading.
- Vaccination and health care: vaccines, antibiotics, doctors and clinics save children and adults.
- More and better food: better farming and transport end famines and hunger.
- Hygiene and health education: washing hands, boiling water, caring for babies.
- Births stay high: children work on farms, care for parents when old, and families expect some to die.
- So natural increase is at its largest and the population grows exponentially.
Farming
- From the 1700s new crops and crop rotation in England meant more food and fewer famines.
Vaccines
- In 1796 Edward Jenner made the first vaccine, against smallpox, a major killer of children.
Sewers
- After cholera outbreaks, London built a sewer system in the 1860s, so drinking water became safer.
Real example today: Niger is in stage 2. Women have more than 6 children on average, and fewer children now die, so its population has more than doubled since 2000, to about 26 million.
Two traps: In stage 2 the death rate is falling, not yet low: do not write 'low death rate'.
'The birth rate is higher than the death rate' is true in stages 2, 3 and 4, so it does not prove stage 2 on its own.
Study smarter, not longer
Most students waste 40% of study time on topics they already know. Our AI tracks your progress and optimizes every minute.
In stage 3 families choose to have fewer children, while the death rate keeps falling. Growth slows, although the population still rises.
Why the birth rate falls
- Contraception and family planning, with sex education, let couples choose how many children to have.
- Women's education and emancipation: women study and work, marry later and have fewer children.
- Fewer children die, so parents no longer need extra births to be sure some survive.
- Urbanisation: city children do not work on farms, and they cost more to feed, house and educate.
- Pensions and welfare: parents rely less on their children in old age.
- Policy and culture: anti-natalist policies, smaller families as the norm, less religious pressure.
- Deaths keep falling as sanitation, health care and food keep improving.
Not enough
- 'Education rises'
- 'Contraception'
- 'The birth rate falls'
A change and its cause
- Women's education delays first births
- Contraception lets couples have fewer children
- Births fall because fewer children die
Real example: in England and Wales from the 1870s, laws limited child labour and made school compulsory by 1880, so children cost money instead of earning it. Contraception spread, and families shrank from about 5 children in the 1870s to about 2 by the 1930s.
Name the change and its cause: Write 'births fell because women stayed in school longer', not just 'education'. Say women's education or sex education. 'Less child labour' or 'fewer babies die' alone is not enough either: say how it cuts births.
As a population ages, fewer people are of child-bearing age, so births fall further.
Asked what moves a country from stage 2 to stage 3? Give reasons for the birth rate falling AND the death rate still falling: answers on only one rate are capped at 2 marks.
In stage 4 births and deaths are both low and the population stops growing. In stage 5 births fall below deaths, so without migration the population shrinks.
Stages 4 and 5
- Stage 4: birth and death rates both low, about 10 per 1000; growth close to zero.
- Fertility is near or below replacement level.
- Stage 5: the birth rate falls below the death rate, a natural decrease.
- Why so few births: children are costly, women have careers, people marry late, many choose few or none.
- The population ages: many older people and fewer young workers.
- Stage 5 was added to the model later; some versions have only four stages.
Stage 4
- Births about equal to deaths
- Stable population
- Ageing begins
Stage 5
- Births below deaths
- Natural decrease
- Many older people
Real examples: the UK is in stage 4, with about 10 births and 10 deaths per 1000 people each year. Japan is in stage 5: deaths have exceeded births every year since 2007, and its population peaked at about 128 million in 2008.
Stage 4 or stage 5?: Compare the two rates. About equal: stage 4. Births below deaths: stage 5. Because some versions of the model stop at four stages, a shrinking country may also be called stage 4.
Practice with exam-style questions
Answer exam-style questions and get AI feedback that shows you exactly what examiners want to see in a full-marks response.
To place a country on the DTM, use its birth and death rates, or the shape of its age-sex pyramid.
| Stage | Birth rate | Death rate | Pyramid shape |
|---|---|---|---|
| 1 | High | High, rises and falls | Wide base, narrows fast: few reach old age |
| 2 | High | Falling fast | The widest base: most people are children |
| 3 | Falling | Low, still falling | Base narrows under 30; few people over 50 |
| 4 | Low | Low | Straight sides: similar numbers in each group up to about 60 |
| 5 | Very low | Low, above births | Narrow base, wide top: more old than young |
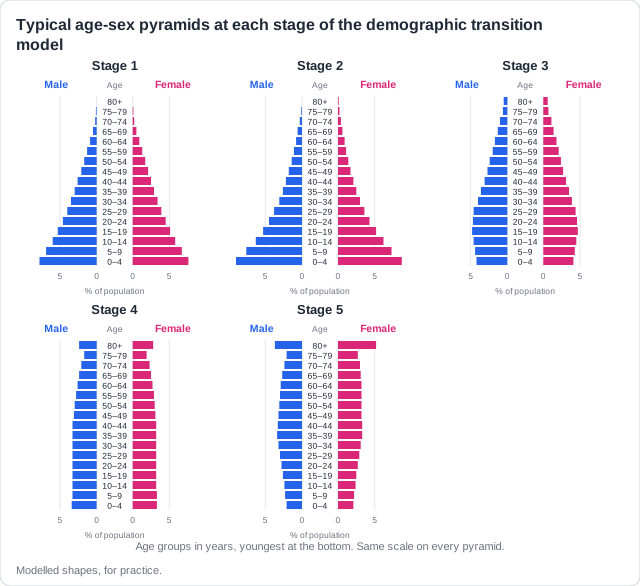
Describe the data, do not just copy it: Say 'a high birth rate of 38 per 1000', not just '38 per 1000'. In stage 2 the death rate is falling, not 'low'.
'Many children' is too vague: say 'the largest group is aged 0-4' or 'a wide base'.
Real example: about half of Niger's people are under 15, so its pyramid has a very wide base: stage 2. In Japan about 29% of people are 65 or over, so its pyramid is wider near the top than at the base: stage 5.
Stage 3, not stage 4: A base that narrows under 30 shows falling births. If there are still few people over 50, and the sides curve inwards higher up because many died young in the past, it is stage 3: the country is moving from stage 2 to stage 4.
The DTM is a model: a simple picture of how populations changed in the past. Like every model, it helps, but it also leaves things out.
Strengths
- A basis for comparing countries
- Fits many countries
- Allows predictions of growth
- Built on historical data
- Links development to births and deaths
Limits
- Many assumptions: too simple
- Eurocentric: based on Europe
- Leaves out migration
- Leaves out war, disease and disasters
- No timescale for each stage
The limits, explained
- Eurocentric: built on the history of Western Europe, so it may not fit other places.
- It predicts where a country may go next, but not when it will get there.
- Countries today move faster: they import medicine and contraception, and cities grow fast.
- Some countries may stay stuck in stage 2 or 3 if poverty keeps birth rates high.
Real example: in Botswana, HIV/AIDS had infected about one adult in four by 2000, and life expectancy fell from over 60 around 1990 to about 50 in the early 2000s. The DTM, which expects death rates only to fall, did not predict this.
Fast and slow transitions: England took about 150 years to go from stage 2 to stage 4. India's fertility rate fell from about 6 children per woman in 1960 to about 2 by 2021: the same change in about 60 years.
Feeling unprepared for exams?
Get a clear study plan, practice with real questions, and know exactly where you stand before exam day. No more guessing.
A country's stage tells its government whether births and deaths are rising or falling. So it can predict growth and choose a policy to match.
Policy by stage
- Stages 1-2, deaths still high: health care, vaccination to cut child deaths, hygiene campaigns, aid.
- Also in stages 1-2: fight poverty and push economic development.
- Stages 2-3, fast growth: contraception and sex education, family planning, women's empowerment.
- Some go further: a later legal marriage age, a limit on children per family, or less immigration.
- Stages 4-5, too few births: pro-immigration policy and money for children (baby bonuses, tax cuts).
- And social help: paid parental leave, flexible work, free childcare and schooling.
- But culture, religion, the economy and politics may shape policy more than the stage does.
Stages 1-2
- Niger: aid-funded campaigns vaccinate children against measles and polio, to cut child deaths.
Stages 2-3
- China, 1980-2015: a one-child policy limited most city couples to one child.
Stages 4-5
- Hungary, from 2020: mothers of four or more children pay no income tax for life.
Link it to the DTM: Every point needs the stage, or its birth and death rates: 'Hungary is in stage 5, with births below deaths, so it pays mothers to have more children.'
Technocentrists say technology has always let human numbers grow past their limits, raising the carrying capacity. The DTM partly agrees.
What the DTM shows about technology
- Stages 1-2: new farming methods, fertilisers, machines and fossil fuels raised the food supply.
- Medicine and sanitation (vaccines, antibiotics, clean water) cut deaths, so populations grew through stage 2.
- Malthus (1798): population will outgrow food. Boserup (1965): need drives new inventions.
- Stages 4-5: growth stops by choice (costly children, careers, city life, policy), not because technology failed.
- Contraception is a technology too: it lets people choose smaller families.
- Limits remain: Earth's carrying capacity is finite, and rich populations have large ecological footprints.
Real example: new farming methods, machines, coal and clean water let the population of England and Wales grow from about 9 million in 1801 to about 32 million in 1901.
A conclusion for a [9]: Technology largely overcame limits in the early stages, but Earth's carrying capacity is finite, and many populations now stabilise through economic and political choices, not new inventions.
Ready to ace The demographic transition model?
You've seen the preview. Here's what you'll unlock:
Bite-Sized Study Notes
Full syllabus broken into chunks that stick
Exam Practice
See exactly how to score full marks
AI Feedback
Know exactly what examiners want
Smart Study Plan
Know exactly what to study next