When a fishery collapses: A fishery collapse happens when fish are caught faster than they can breed, year after year, until too few are left to rebuild the stock.
The points to remember
- Fish are renewable, but only if the catch is no more than the natural increase.
- Catch more, and the stock shrinks: fewer adults, so fewer young the next year.
- Warning signs: smaller fish, lower catch for the same effort, boats fishing further and deeper.
- Past a tipping point, the stock cannot recover even when fishing stops: collapse.
- World catches rose until about 1990, then levelled off at about 90 million tonnes.
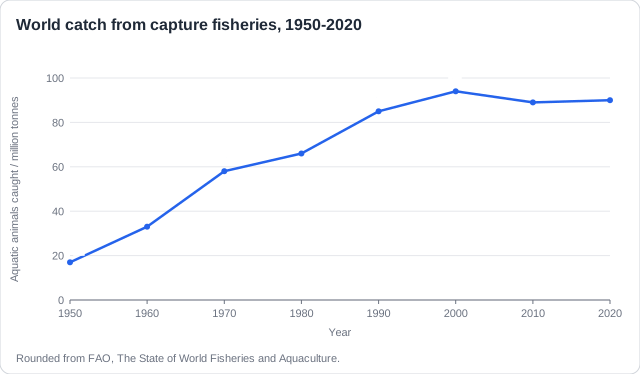
Why world catches rose
- More people and more demand for fish.
- Better technology: sonar, bigger boats and nets.
- Fleets moved to new grounds and deeper water.
Why they levelled off
- Many stocks overfished and depleted.
- No new grounds left to fish.
- Quotas and rules; aquaculture took some demand.
- Climate change and pollution.
Renewable is not the same as unlimited: Overfishing can push a renewable stock so low that it cannot recover, so it behaves like a non-renewable resource. That is what a collapse is.
Free preview
This is the free notes preview
You're reading the free notes. Aimnova Pro unlocks the full study experience — and you can try it with your first topic free to keep:
- FlashcardsLock in vocabulary and key terms with spaced repetition.
- Practice questionsAnswer exam-style questions and get instant AI marking.
- Mock exams & past-paper vaultSit full mocks and see exactly how examiners award marks.
- Personalised study planA daily plan built around your exam date and weak areas.
The Grand Banks were one of the richest fishing grounds on Earth. People fished their cod for almost 500 years before the stock collapsed.
Up to the 1950s
Catches of about 200 000-300 000 tonnes a year, mostly by small boats near the coast.
1960s: the boom
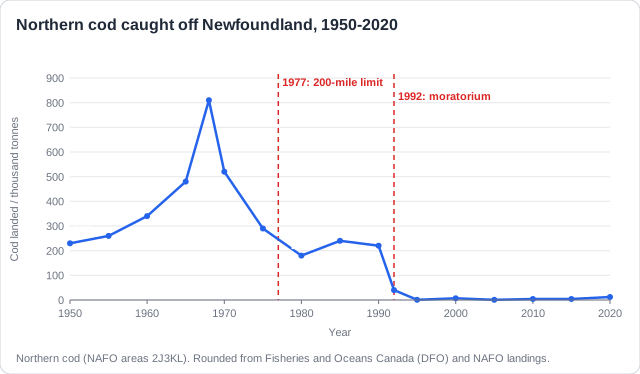
Factory trawlers from Europe and the USSR fish all year with sonar; the catch peaks at 810 000 tonnes in 1968.
1977: the 200-mile limit
Canada pushes foreign fleets out, then builds up its own fleet; catches recover to about 250 000 tonnes.
2 July 1992: the moratorium
The stock has crashed; Canada bans cod fishing. About 35 000 people lose their jobs.
Reading the graph (SL). The catch rose from about 230 000 tonnes in 1950 to 810 000 in 1968, fell to 180 000 by 1980, then stayed near 200 000-250 000 until it crashed in 1992. Since then it has stayed below 15 000 tonnes: a dramatic and lasting decrease.
Know your predicted grade
Take timed mock exams and get detailed feedback on every answer. See exactly where you're losing marks.
Scientists who studied the collapse, led by Ransom Myers, concluded that it was caused mainly by overfishing, not by changes in the sea.
The points to remember
- Too many boats, too efficient: factory trawlers, sonar and huge nets caught the shoals.
- Quotas set too high: scientists overestimated how many cod there were.
- Trawlers kept making big catches because cod gathered in dense shoals, so the stock looked healthy.
- Small young cod were caught and thrown away, so fewer grew up to breed.
- Politics: thousands of jobs depended on the catch, so cuts came too late.
- Cold water in the early 1990s may have added stress, but was not the main cause.
Remember it as: Too many boats, too high quotas, too late.
Example (SL): what fishers saw. In the 1980s fishers in small inshore boats told the government that their catches were falling and the cod were smaller. The offshore trawlers were still filling their nets, so the warnings were not acted on until it was too late.
Name the cause: overexploitation: 'The cod died out' or 'the water got colder' does not explain a collapse. Say that catches were greater than the stock's natural increase for many years, and give the reasons why.
A collapse is lasting: thirty years after the moratorium, the northern cod were still far below their old numbers. The costs reached far beyond the fish.
The points to remember
- Cod breed only at 6-7 years old, and the big old females, which lay the most eggs, were gone.
- With so few adults, too few young are produced to rebuild the stock.
- The food web changed: their food (capelin) crashed; shrimp and snow crab boomed.
- Jobs: about 35 000 people lost work; whole villages emptied as young people left.
- Food: a cheap source of protein disappeared from local tables.
- In 2024 Canada reopened a small fishery: 18 000 tonnes, about 2% of the 1968 catch.
Example (SL): Newfoundland's outports. In small fishing villages, almost every family depended on cod. The government paid about CA$1.9 billion in support and retraining, but many people moved away. Fishers who stayed switched to catching crab and shrimp.
Removing a top predator: When a top predator such as cod is fished out, its prey increase and the whole food web changes: a trophic cascade. The ecosystem may settle into a new state that does not go back.
Get feedback like a real examiner
Submit your answers and get instant feedback — what you did well, what's missing, and exactly what to write to score full marks.
Not every crash is a lasting collapse. Some stocks recover when fishing stops; others crash because of nature and fishing together. Reading a catch graph means linking each rise and fall to a cause.
Reasons a catch rises
- More boats at sea.
- Better technology.
- New fishing grounds.
- The stock recovers after a closure.
- Higher quotas or more demand.
Reasons a catch falls
- Overfishing: fewer fish left.
- Stricter quotas, fewer boats, bigger mesh.
- More predators or less prey.
- Less demand in the markets.
- Climate change or El Niño moves or kills fish.
Example (SL): North Sea herring. Big catches in the 1960s and 1970s, with new purse-seine boats, overfished the stock. The fishery was closed from 1977 to 1981, and the herring recovered by the late 1980s. Because fishing stopped in time, this was a crash, but not a lasting collapse.
Link every reason to a rise or a fall: 'Overfishing' alone is not enough: say that overfishing reduced the stock, so the catch fell. Each reason earns a mark only when it is tied to the direction of the change.
How this comes up: Paper 1 gives a graph of a fish catch over time and asks for factors that explain the changes [2]; Paper 2 asks for a reason for a trend in world catches [1].
The graph shows the catch of northern cod off Newfoundland from 1950 to 2020.
With reference to the graph, identify two factors which may account for the changes in the catch of northern cod.
Model answer plan
See the mark-by-mark plan — for / against / judgement, with marking guidance — in study mode.