The world eats more food from the water every year: Demand for fish, shellfish and seaweed is rising for two reasons: there are more people, and each person is eating more of it as diets change.
The points to remember
- Each person eats about 20.7 kg of aquatic animal food a year (2022), more than twice the 9.1 kg of 1961.
- Total aquatic food eaten grew about 3% a year since 1961, nearly twice as fast as the population (about 1.6%).
- World production of aquatic animals reached about 185 million tonnes in 2022.
- FAO expects about 205 million tonnes by 2032, most of the extra from aquaculture.
- Evidence comes from catch and farm statistics, food eaten per person, trade and prices.
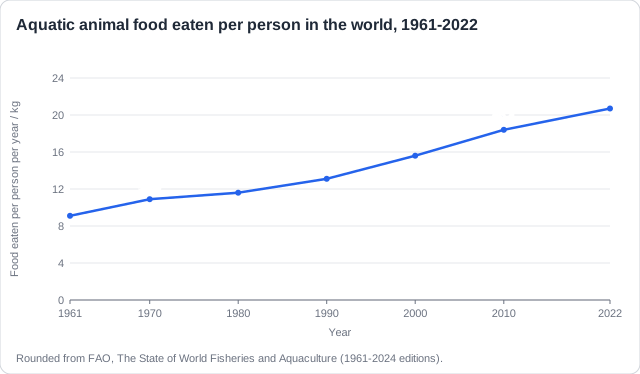
Reading the graph (SL). Food eaten per person rose in every decade, from 9.1 kg in 1961 to 20.7 kg in 2022. That is an increase of (20.7 - 9.1) ÷ 9.1 x 100 = about 127%, while the number of people also rose from about 3 billion to 8 billion.
Free preview
This is the free notes preview
You're reading the free notes. Aimnova Pro unlocks the full study experience — and you can try it with your first topic free to keep:
- FlashcardsLock in vocabulary and key terms with spaced repetition.
- Practice questionsAnswer exam-style questions and get instant AI marking.
- Mock exams & past-paper vaultSit full mocks and see exactly how examiners award marks.
- Personalised study planA daily plan built around your exam date and weak areas.
The first reason is simple: more mouths to feed. Even if each person ate the same amount, more people would mean more fish, shellfish and seaweed eaten.
The points to remember
- World population rose from about 2.5 billion (1950) to 8 billion (2022).
- The UN expects about 9.7 billion people by 2050.
- Most growth is in Africa and Asia, where many people already rely on fish for protein.
- Many people live near coasts, rivers and lakes, where aquatic food is close at hand.
Remember it as: More people, more plates.
Example (SL): Nigeria. About 220 million people lived in Nigeria in 2022, and the UN expects about 375 million by 2050. Fish is a main source of animal protein there, and Nigeria already imports large amounts of frozen fish, such as mackerel, to meet demand.
Stop wasting time on topics you know
Our AI identifies your weak areas and focuses your study time where it matters. No more overstudying easy topics.
The second reason is that diets are changing: people who can afford it choose more fish and seafood.
The points to remember
- Rising incomes (affluence): people buy more protein, including valued foods such as shrimp, salmon and oysters.
- Health: fish is a lean protein, rich in omega-3 oils; doctors advise eating it twice a week.
- Cities and supermarkets: more people buy food in shops instead of growing it.
- Refrigeration, freezing and air freight let fresh fish reach inland cities and other countries.
- Global tastes: sushi, poke and fish curries spread around the world.
Remember it as: Richer, healthier, cooler, global.
Example (SL): China. As incomes rose, each person in China went from eating about 4 kg of aquatic food a year in 1961 to about 40 kg today, twice the world average. China now eats about a third of all the aquatic food in the world.
Questions show a graph and ask for a reason for a trend: why aquaculture keeps rising, or why a harvest is expected to grow by 2050. Give one clear cause linked to the trend.
Reasons on the demand side
- More people need more food.
- More demand for high-protein food.
- Richer people buy valued foods: shrimp, salmon, oysters.
- Healthier diets; fish replaces some meat.
- More fishmeal and fish oil wanted for feed.
Reasons on the supply side
- Wild catches have stopped growing, so farming fills the gap.
- Better farming technology and breeding of fast-growing stock.
- Farmed fish turn feed into food more efficiently than cattle.
- Farming is profitable; governments support it for food security.
- Mussels and oysters filter their own food, so they are cheap to farm.
The points to remember
- Link the reason to the trend shown: a rise, a projected rise, a levelling off.
- Give one reason if asked for one: only the first answer is marked.
- Rising demand has consequences: overfishing of wild stocks, more aquaculture, higher prices, more imports by rich countries.
Example (SL): Peru's anchoveta. Most of the anchoveta caught off Peru is ground into fishmeal and oil to feed farmed salmon and shrimp. So the demand for farmed fish in rich countries is also demand for wild fish in Peru.
See how examiners mark answers
Answer exam-style questions with model answers. Learn exactly what earns marks and what doesn't.
How this comes up: Paper 2 Section A gives a graph of catches or harvests and asks for a reason for a trend [1-2].
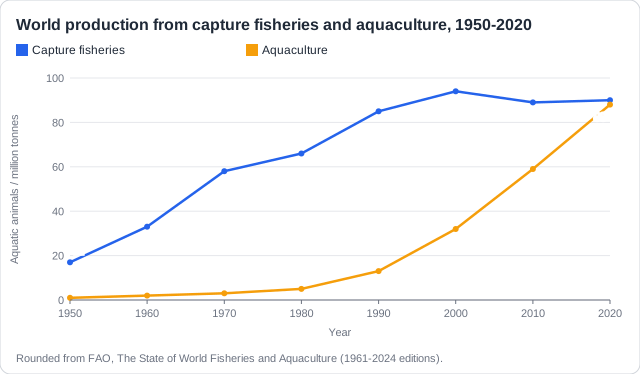
The graph shows world production from capture fisheries and aquaculture from 1950 to 2020.
Using the graph, outline two reasons for the trend in aquaculture production since 1980.
Model answer plan
See the mark-by-mark plan — for / against / judgement, with marking guidance — in study mode.