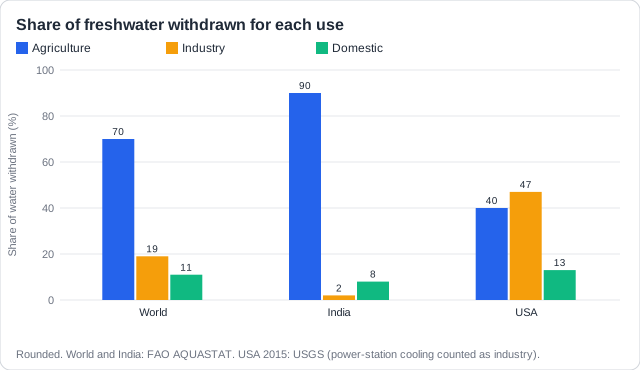
Homes, farms and factories: People use water in three main ways: domestic use, agriculture (irrigation and livestock) and industry. Worldwide, farms use about 70% of the freshwater people take.
The points to remember
- Domestic use: drinking, cooking, washing, flushing toilets, watering gardens (about 11% worldwide).
- Agriculture: irrigation of crops and water for livestock (about 70% worldwide).
- Industry: making goods, mining, and cooling power stations (about 19% worldwide).
- In lower-income countries farming can take up to 90%; industry and homes use little.
- In higher-income countries industry, power stations and homes take a bigger share.
Remember it as: Homes, farms, factories: farms drink the most.
Lower-income countries
- Farming uses most water, up to 90%
- Less industry
- Less water per person at home
- Irrigation often less efficient: whole fields flooded
Higher-income countries
- Industry and power stations use more
- More water per person at home
- More efficient irrigation: drip and sprinklers
- More water treated and reused
Real example: in India, about 90% of the water people withdraw goes to farms, mostly to irrigate rice, wheat and sugar cane. Homes take less than a tenth.
Free preview
This is the free notes preview
You're reading the free notes. Aimnova Pro unlocks the full study experience — and you can try it with your first topic free to keep:
- FlashcardsLock in vocabulary and key terms with spaced repetition.
- Practice questionsAnswer exam-style questions and get instant AI marking.
- Mock exams & past-paper vaultSit full mocks and see exactly how examiners award marks.
- Personalised study planA daily plan built around your exam date and weak areas.
When a population grows, or a country becomes richer, its demand for water rises. It must then find more water, or use the water it has more efficiently.
Why demand rises
- More people need more water to drink and wash, and more food, so more irrigation.
- Richer diets with more meat need far more water: the animals' feed is irrigated.
- Higher living standards: showers, flush toilets, washing machines, pools, lawns, car washing.
- Urbanisation: cities wash streets and water parks, and long pipes leak on the way.
- Industry and power stations grow as a country develops.
- A drier, hotter climate means more irrigation, more watering of lawns and more drinking.
Remember it as: More mouths, more meat, more machines.
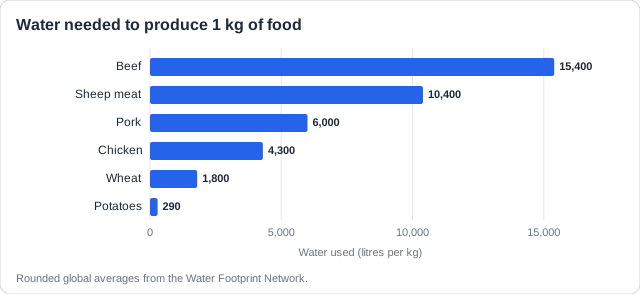
Real example: 1 kg of beef takes about 15,400 litres of water, mostly to grow the cattle's feed; 1 kg of wheat takes about 1,800. As people eat more meat, farm water use rises.
People raise demand
- Population growth
- More intensive farming and irrigation
- Rising living standards and industry
People cut the usable supply
- Pollution makes water unsafe to use
- Dams upstream take water from people downstream
- Paved cities: rain runs off instead of soaking in
Match the reason to the question: If a chart shows industry and energy staying flat, reasons about factories or power stations do not count: give reasons for the sectors that grow, such as homes and farms.
If a question says 'not related to climate change', a drier climate is not a valid reason: give human causes.
Know your predicted grade
Take timed mock exams and get detailed feedback on every answer. See exactly where you're losing marks.
Farms do not use the same amount every month: Farmers irrigate most when there is little rain, when it is hot and when crops are growing. Some crops are much thirstier than others, so what a region grows matters too.
The points to remember
- More irrigation when rainfall is low; less when it rains, because rain waters the crops.
- Higher temperatures mean more evaporation from soil and leaves, so crops need more water.
- Crops need most water in the growing season, when they grow fast.
- Thirsty crops such as cotton, rice and sugar cane need far more water than most.
- Farm demand can fall with better irrigation, drought-resistant crops, less meat or fewer thirsty crops.
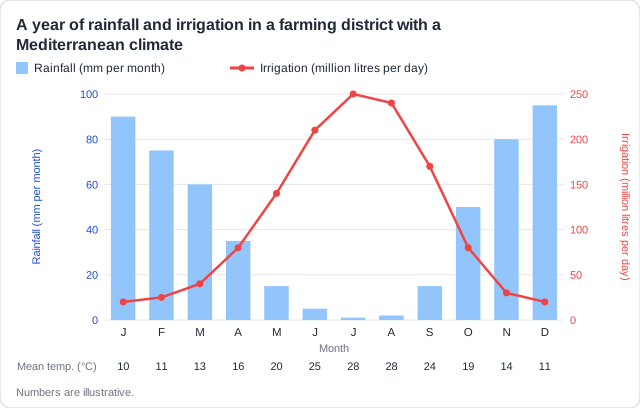
Reading a farm chart: Quote the graph: 'irrigation peaks in July, when rainfall is lowest and the temperature highest'.
In a bar chart of crops, the crop under the greatest water stress is the longest bar: just name it. Worldwide, more than half of cotton is grown under high water stress.
Real example: from the 1960s the Soviet Union took water from the two rivers feeding the Aral Sea to irrigate cotton in the desert. The sea shrank by about 90%.
Give the reason, not the pattern: 'More water is used in summer' only describes the graph. Say why: less rain, more evaporation in the heat, or the growing season. Use drought-resistant crops or better irrigation to explain a fall in farm demand.
A society with rising demand has two answers: increase the supply of water, or use each litre more efficiently. Most places need both.
Increase the supply
- Dams and reservoirs store wet-season water
- Wells pump groundwater
- Desalination
- Collecting rainwater from roofs
Use water more efficiently
- Drip irrigation
- Fixing leaking pipes
- Efficient showers, toilets and washing machines
- Reusing grey water
- Drought-resistant crops
- Factories reusing cooling water
Ways to use water more efficiently
- Drip irrigation wastes far less than flooding fields: more crop per litre.
- Fix leaks: old city pipes can lose a large share of water before it reaches a tap.
- Price and meters: when water costs more, people use less.
- Recycle: treated waste water and grey water can water crops, parks and toilets.
- Industry can reuse its cooling and process water instead of taking more.
- Lower-income countries often flood fields: cheaper to set up, but much water evaporates.
Remember it as: Find more, or waste less.
Real example: drip irrigation was developed in Israel, one of the driest countries in the world. Israel also treats its sewage and reuses most of it, about 85-90%, to water crops.
Name the method and what it saves: 'Save water' is too vague. Say what changes and why less water is needed: 'drip irrigation puts water at the roots, so less evaporates'. Ways to increase supply are covered in depth on the next page.
Get feedback like a real examiner
Submit your answers and get instant feedback — what you did well, what's missing, and exactly what to write to score full marks.
Two things to judge: quality and availability: Growing cities change freshwater in two ways: its quality (how clean it is) and its availability (how much there is to use). Some changes are harmful; others help.
- Waste-water treatment
- cleaning used water in a plant before it returns to a river.
- Heavy metals
- toxic metals such as lead and mercury; they leach (wash out) of landfill and factory waste into water.
- Suspended solids
- tiny bits of soil floating in water; when they settle on the river bed, that is sedimentation.
- Aquifer
- a layer of rock or soil underground that holds water; wells are drilled into it.
- Grey water
- used water from sinks, showers and washing machines, reused for toilets or gardens.
- Reverse osmosis
- pushing water through a very fine filter (a semi-permeable membrane) that holds back salt and dirt.
- Acid precipitation
- rain or snow made acid by gases from burning fuels.
How cities affect freshwater
- Sewage: where waste water is not treated, it carries germs and nutrients into rivers.
- Heavy metals leach from landfill, factories and roads into rivers and groundwater.
- Building sites wash soil into rivers: suspended solids and sedimentation.
- Factory and traffic fumes cause acid precipitation, which acidifies lakes and streams.
- Cities drill wells and over-pump aquifers: water tables fall and the ground can sink.
- Concrete stops rain soaking in: fast runoff and flooding, and less water refilling aquifers.
- But cities can treat sewage, reuse grey water and make freshwater by reverse osmosis.
Real example: Mexico City pumps much of its water from the aquifer beneath it, faster than rain refills it. As the ground dries and compacts, parts of the city sink by tens of centimetres a year, cracking pipes and buildings.
Cover both, and the good side: For each city effect, say whether it changes quality or availability. Then add what cities can do to help: treat sewage, reuse grey water, make drinking water from seawater.
The biggest user, and a spread-out polluter: Farms use most of the world's water, and what washes off their fields can pollute rivers, lakes and groundwater over huge areas.
- Leaching of fertilisers
- rain washing nitrates and phosphates from fields down into groundwater and rivers.
- Eutrophication
- extra nutrients make algae grow fast; when they die and rot, the water loses its oxygen and fish die.
- Pesticides
- chemicals that kill insects, weeds or fungi on crops.
- Bioaccumulation
- a chemical building up inside one living thing over its life.
- Biomagnification
- a chemical becoming more concentrated at each step up a food chain.
- Drip irrigation
- pipes that drip water straight onto each plant's roots.
How farms affect freshwater
- Availability: irrigation takes about 70% of the water people withdraw worldwide.
- Pumping for irrigation lowers aquifers and can dry up rivers and lakes.
- Leaching of fertilisers carries nitrates and phosphates into water: eutrophication.
- Pesticides wash into rivers; they bioaccumulate in animals and biomagnify up food chains.
- Ploughed soil erodes into rivers: sediment clouds the water.
- Fixes: drip irrigation, less fertiliser at the right time, strips of plants beside rivers.
Real example: in August 2014, fertiliser from farms fed a toxic algal bloom in Lake Erie. About 400,000 people in Toledo, Ohio, were told not to drink their tap water for three days.
Weigh both sides: In a 'cities or farms' essay, give each side's effects on quality AND availability, the good ones too, with real places. End with a judgement, for example: cities cause a wider range of pollution but can make freshwater from sewage and seawater; farms use far more water.
Learn what examiners really want
See exactly what to write to score full marks. Our AI shows you model answers and the key phrases examiners look for.
Percentage of the total: Percentage = (part ÷ total) × 100
How to use it
- Write the formula first: percentage = (part ÷ total) × 100.
- In a stacked bar, read the value of each block for that year.
- Add every sector in that year to get the total.
- Divide, multiply by 100, round to one decimal place and write the % sign.
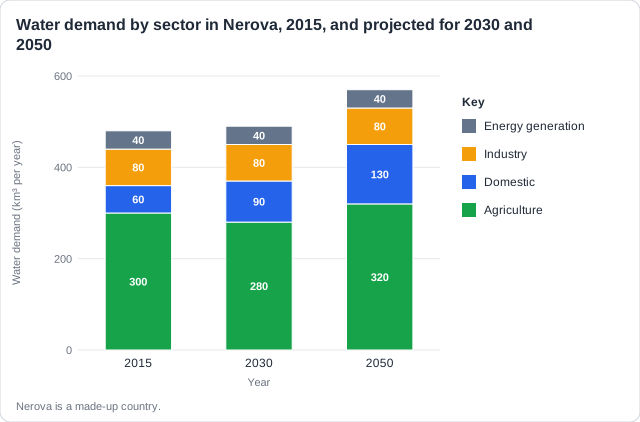
Worked example: What percentage of Nerova's water is for agriculture in 2030? Part = 280 km³. Total = 280 + 90 + 80 + 40 = 490 km³. Percentage = (280 ÷ 490) × 100 = 57.1%.
Check it: farming is the biggest block, so its share must be more than half.
Two slips to avoid: Write the % sign: '57.1' alone is not a percentage. And use the total for the same year as the part.
How this comes up: Paper 2, Section A: a chart of water use by sector, then a percentage, a reason and two reasons.
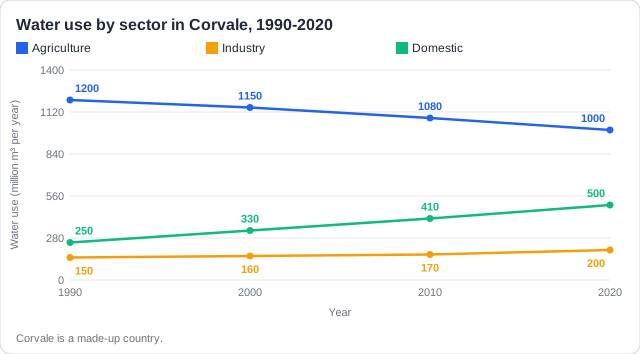
Figure 1 shows water use by sector in Corvale, a country whose population and incomes have grown since 1990.
(a) Calculate the percentage of Corvale's water used for domestic purposes in 2020.
(b) Suggest one reason why water use for agriculture fell between 1990 and 2020.
(c) Outline two reasons why domestic water use rose between 1990 and 2020.
Model answer plan
See the mark-by-mark plan — for / against / judgement, with marking guidance — in study mode.