Weather and climate at Higher Level: The same ideas as SL, with different places: the 'Beast from the East', Mawsynram's monsoon rain, Rome's dry summers and Mumbai's rainfall year by year. At HL, the long climate records met here are the data behind the climate models later in this topic.
Practise this as you read
- Separate a single event (weather) from a long-term pattern (climate).
- Quote values and years whenever you describe climate data.
Free preview
This is the free notes preview
You're reading the free notes. Aimnova Pro unlocks the full study experience — and you can try it with your first topic free to keep:
- FlashcardsLock in vocabulary and key terms with spaced repetition.
- Practice questionsAnswer exam-style questions and get instant AI marking.
- Mock exams & past-paper vaultSit full mocks and see exactly how examiners award marks.
- Personalised study planA daily plan built around your exam date and weak areas.
Weather is today; climate is the pattern: Weather changes all the time. Climate is the pattern you would expect there in each season.
The points to remember
- Weather = the state of the atmosphere at one place and time: hours or days.
- It is described by temperature, precipitation, wind, cloud and humidity.
- Climate = the typical (average) conditions of a place over a long period, usually 30 years.
- Climate is what you can expect; weather is what you get on one day.
- One unusual day or season is weather; a change in the 30-year average is a change in climate.
Weather
- Hours to days
- One place, one time
- 'It is raining in London today'
- Hard to forecast beyond about 10 days
Climate
- About 30 years of averages
- The typical pattern of a place
- 'London is mild, with rain all year'
- Changes slowly, over decades
Remember it as: Climate is what you expect; weather is what you get.
Real example: in February 2018 a cold wind from Siberia, nicknamed the 'Beast from the East', brought snow and freezing days to the UK. That was weather: the same year, England had one of its hottest summers on record.
Never wonder what to study next
Get a personalized daily plan based on your exam date, progress, and weak areas. We'll tell you exactly what to review each day.
Why is one place a desert and another a rainforest? A place's climate comes from physical processes in the atmosphere: how much energy it gets from the Sun, and how air and water move that energy around.
The points to remember
- Climate results from physical processes in the atmosphere, driven by energy from the Sun.
- Latitude: near the equator the Sun is higher in the sky, so places are warmer.
- Rising air cools and makes rain; sinking air warms and stays dry (deserts).
- Winds carry heat and moisture; winds from the sea bring rain, winds from land are drier.
- Distance from the sea: the sea warms and cools slowly, so coasts have milder seasons.
- Altitude: air is about 6.5 °C cooler for every 1,000 m higher.
- Ocean currents: a cold current cools the coast and makes rain less likely.
Energy in
- Latitude sets how much sunlight arrives.
- Altitude: higher is colder.
Air moving
- Rising air: clouds and rain.
- Sinking air: clear and dry.
Land and sea
- Coasts: mild seasons.
- Cold currents: dry coasts.
Real example: Mawsynram in north-east India is one of the wettest places on Earth, with nearly 12,000 mm of rain a year. Wet monsoon winds from the Bay of Bengal are forced up the Khasi Hills, so the air cools and drops its rain.
Link 2.4: These same processes, and the three-cell pattern of air circulation, explain where the biomes are.
The guide names two main factors in a place's climate: how its temperature and its precipitation change through the seasons. A climate graph shows both on one chart.
The points to remember
- The main factors in a place's climate are its seasonal changes in temperature and precipitation.
- A climate graph shows both: bars = precipitation each month, line = mean temperature.
- Temperature range = warmest month minus coldest month.
- Find the wettest and driest months, and any wet or dry season.
- Read each axis: temperature on one side (°C), precipitation on the other (mm).
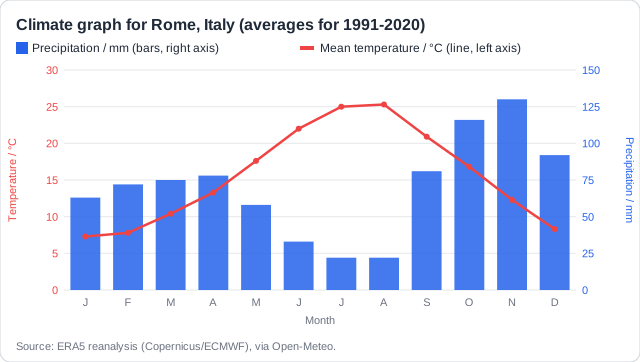
Temperature range
Warmest August 25.3 °C, coolest January 7.3 °C: a range of 18 °C.
Wettest month
November, with 130 mm.
Seasons
Driest in July and August (22 mm each): a dry, hot summer.
Real example: Rome has a Mediterranean climate. In summer, high pressure sits over the Mediterranean and sinking air keeps the skies clear; in winter, storms from the Atlantic bring rain.
Stop wasting time on topics you know
Our AI identifies your weak areas and focuses your study time where it matters. No more overstudying easy topics.
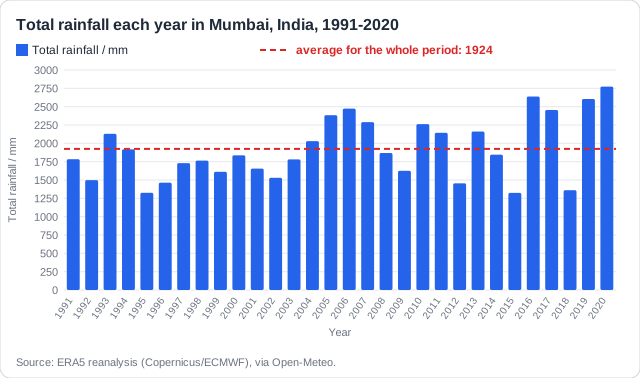
Papers give a chart of one variable, year after year, and ask you to describe it. Each point needs evidence from the chart.
The points to remember
- Say whether the data is variable (goes up and down) and whether there is an overall trend.
- Name any periods of rise or fall, with their years.
- Give the highest and the lowest values, with their years and units.
- Compare with the average line: which years sit above it, which below.
- Quantify: at least one number from the graph, or you lose a mark.
- Do not contradict yourself: 'no trend' and then 'a falling trend' cancel out.
Pattern
Highly variable; most years before 2004 were below the average.
Highest and lowest
Highest in 2020 (2,774 mm); lowest in 2015 (1,324 mm).
Average
The average is about 1,924 mm; four of the last five years were above it.
Two traps: Do not write 'there is no trend' and then describe a trend. Do not describe what is missing from the chart (a gap in the data): describe the data that is there.
One cold winter does not cancel a warming climate: Weather swings from day to day and year to year. Climate change is a slow shift in the averages, so you can only see it in data over decades.
The points to remember
- One very cold winter or one hot day is weather: it does not prove or disprove a change in climate.
- Climate change shows as a long-term trend in averages over decades.
- Short-term dips happen: a big volcanic eruption can cool the world for 1 to 2 years.
- El Niño years are warmer worldwide, La Niña years cooler; they last about a year.
- So judge a trend over 30 years or more, not from one year or one place.
Real example: in June 1991 Mount Pinatubo in the Philippines erupted. Its aerosols cooled the world by about 0.5 °C for around two years; then warming carried on.
Say it in one sentence: 'A single cold winter is weather in one place; climate change is a long-term rise in the average temperature, shown by data over 30 years or more.'
See how examiners mark answers
Answer exam-style questions with model answers. Learn exactly what earns marks and what doesn't.
How this comes up: Paper 1: a bar chart of one variable year by year, then 'Describe the data' [2]. One point must use a number from the chart.
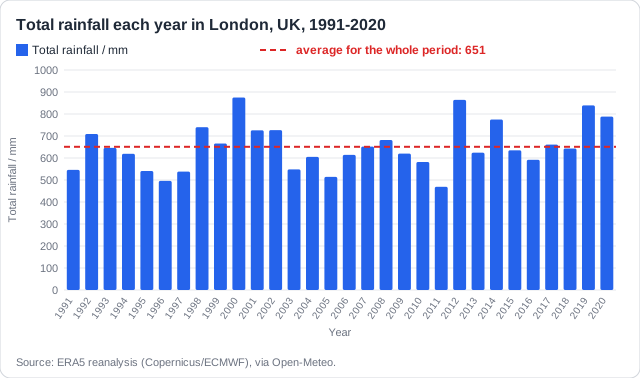
London has a mild climate, with rain in every month. The figure shows the total rainfall in London each year from 1991 to 2020.
Describe the rainfall data shown in the figure.
Model answer plan
See the mark-by-mark plan — for / against / judgement, with marking guidance — in study mode.