Measuring water quality at Higher Level: At HL, measurements feed into two tools you meet later: a biotic index and a water quality index. Here you learn the measurements themselves and how to design monitoring. Your examples differ from SL: Singapore's sensors, the Thames' recovery, the BMWP score and Montreal's 2015 sewage release.
Practise this as you read
- Describe a monitoring method: what, how, where and when.
- Read a real data set: trend, reason, limit.
Free preview
This is the free notes preview
You're reading the free notes. Aimnova Pro unlocks the full study experience — and you can try it with your first topic free to keep:
- FlashcardsLock in vocabulary and key terms with spaced repetition.
- Practice questionsAnswer exam-style questions and get instant AI marking.
- Mock exams & past-paper vaultSit full mocks and see exactly how examiners award marks.
- Personalised study planA daily plan built around your exam date and weak areas.
Three kinds of measurement: Water quality is the measurement of the chemical, physical and biological characteristics of water. Monitoring it shows where pollution comes from and whether a clean-up is working.
The points to remember
- Water quality = the chemical, physical and biological characteristics of water.
- Physical: temperature, turbidity, total suspended solids.
- Chemical: dissolved oxygen, pH, nitrates, phosphates, metals such as lead or mercury.
- Biological: the living things present, e.g. indicator species, bacteria counts.
- It varies with place, season, weather and time of day, so it is measured again and again.
- Results can be combined into one score, a water quality index; the data guide management.
| Kind | What is measured | How |
|---|---|---|
| Physical | Temperature | Thermometer or temperature probe |
| Physical | Turbidity, suspended solids | Secchi disc, turbidity tube; filter and weigh |
| Chemical | Dissolved oxygen, pH | Oxygen probe; pH probe or strips |
| Chemical | Nitrates, phosphates, metals | Test kits; laboratory spectrometry |
| Biological | Indicator species, bacteria | Kick sampling and a key; microscope counts |
Remember it as: Physical, chemical, biological: how it looks, what is in it, what lives in it.
Real example: Singapore checks its reservoirs with sensors that send readings of pH, oxygen and turbidity every few minutes, so a pollution event is spotted within hours.
Study smarter, not longer
Most students waste 40% of study time on topics they already know. Our AI tracks your progress and optimizes every minute.
Physical measures show how warm and how cloudy the water is. High turbidity cuts the light that water plants need.
The points to remember
- Temperature: a thermometer or temperature probe, at the same depth each time.
- Turbidity: a Secchi disc lowered until it disappears (lakes), or a turbidity tube (rivers).
- Total suspended solids: filter a measured volume of water, dry the filter, weigh what it caught.
- Shallow Secchi depth, cloudy tube or heavy filter = more particles: soil, algae or sewage.
Lower the disc
A black-and-white disc on a rope marked in centimetres, from the shady side of the boat.
Watch it vanish
Note the depth at which you can no longer see it.
Repeat and average
Raise it until it reappears, note that depth, and use the mean of the two.
Real example: warm water from power stations once made stretches of the River Thames too warm and low in oxygen for fish; temperature probes now log it every few minutes.
Chemical measures show what is dissolved in the water. The most important for life is dissolved oxygen, measured with a probe.
The points to remember
- Dissolved oxygen: an oxygen probe, or a chemical titration (the Winkler method).
- pH: a pH probe, or pH strips / universal indicator.
- Nitrates and phosphates: colour-change test kits compared with a chart, or a probe.
- Metals (lead, mercury): samples sent to a laboratory for spectrometry.
- BOD: measure oxygen, keep the sample dark for 5 days, measure again (taught on the next page).
- In an answer, always give what is measured AND how: 'pH, using a pH probe'.
Dissolved oxygen
- Oxygen probe or Winkler titration
- Low = fish suffocate
pH
- pH probe or strips
- Acid rain or mine water lowers it
Nitrate, phosphate
- Colour test kit or probe
- High = risk of algal blooms
What AND how: 'Test the pH' is only half an answer. 'Measure pH with a pH probe' scores. Each way of measuring is one point: the thing measured plus the tool.
Real example: in the 1950s parts of the tidal Thames had almost no dissolved oxygen. Better sewage treatment raised it, and over 100 species of fish now live in the river.
Practice with exam-style questions
Answer exam-style questions and get AI feedback that shows you exactly what examiners want to see in a full-marks response.
Living things show what the water has been like for weeks or months. An indicator species is the key.
The points to remember
- Indicator species: some animals live only in clean water, others tolerate pollution.
- Kick sampling: kick the riverbed for a set time, catching animals in a net held downstream.
- Identify and count them with a key or an app; note which indicator species are present.
- Turn the result into a biotic index: a score that is high for clean water, low for polluted.
- Advantage: it shows the real effect on living things, and the combined effect of all pollutants.
- Also cheap (no lab needed) and the score is easy to understand. Chemical tests name the pollutant.
Clean water
- Stonefly and mayfly larvae
- Need lots of dissolved oxygen
- High biotic index score
Polluted water
- Sludge worms and bloodworms
- Survive with little oxygen
- Low biotic index score
What does NOT score: 'Use fish' and 'measure biodiversity' alone are not a biotic-index method. 'It shows pollution over time' or 'it is quicker' are not accepted advantages: say it shows the effect on living things, or the combined effect of pollutants, or that it is cheap.
Real example: the UK's BMWP score gives each insect family points for its tolerance: up to 10 for stoneflies, as little as 1 for sludge worms. A high total means clean water.
A good monitoring plan answers one question: is this source harming the water? The design matters as much as the tool.
The points to remember
- Sample upstream and downstream of the source: the upstream site is the comparison.
- Sample before and after a release, or compare with historic records.
- Take samples along the river from the source, to see how far the pollution spreads.
- Sample over time (days, months, seasons) to see whether the water recovers.
- Repeat samples at each site and use the mean; keep the method the same each time.
- The data inform management: find the source, set limits, check that a clean-up works.
Before
- Coliform counts taken before the release: 10 or fewer
During
- Counts along the river one day in: up to 120 000
Along
- Sites from the outfall downstream to map the plume
After
- Repeated daily: back to normal in 4 to 10 days
Remember it as: Above and below, before and after, repeat and average.
Feeling unprepared for exams?
Get a clear study plan, practice with real questions, and know exactly where you stand before exam day. No more guessing.
Papers give you real measurements to read. Use the same four steps every time.
How to read a water-quality data set
- Read the units and what a high or low value means (deeper Secchi = clearer).
- Describe the trend: the overall change, with numbers and years quoted.
- Give a reason for the change, linked to a source of pollution.
- Say what the data cannot show: one measure, few years, one site.
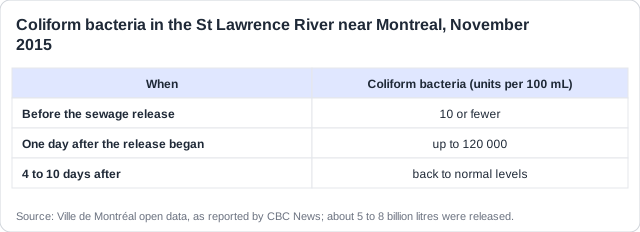
Worked answer: Change: coliform bacteria rose from 10 or fewer to up to 120 000 units per 100 mL, a rise of over 10 000 times, within a day. Reason: about 5 to 8 billion litres of raw sewage, full of faecal bacteria. Recovery: back to normal in 4 to 10 days, as the river diluted and carried it away. Limit: bacteria counts alone do not show the effect on oxygen or wildlife.
How this comes up: Paper 1: describe a method to monitor the impact of a sewage release [3]. Tool, sites, time.
In 2015 the city of Montreal released between 5 and 8 billion litres of untreated sewage into the St Lawrence River over four days.
Describe a method to monitor the impact of this release on the St Lawrence River ecosystem.
Model answer plan
See the mark-by-mark plan — for / against / judgement, with marking guidance — in study mode.