Maximum sustainable yield at Higher Level: Different examples from SL: Alaska pollock, three fleets on the curve, and bluefin tuna caught at four times the advice. At HL, go on to how stocks are assessed (4.3.12) and the risks of fishing exactly at the MSY (4.3.13).
Practise this as you read
- Read the yield and fishing-effort graph.
- Evaluate MSY as a guide to managing a fishery.
Free preview
This is the free notes preview
You're reading the free notes. Aimnova Pro unlocks the full study experience — and you can try it with your first topic free to keep:
- FlashcardsLock in vocabulary and key terms with spaced repetition.
- Practice questionsAnswer exam-style questions and get instant AI marking.
- Mock exams & past-paper vaultSit full mocks and see exactly how examiners award marks.
- Personalised study planA daily plan built around your exam date and weak areas.
The biggest catch you can take for ever: The maximum sustainable yield (MSY) is the largest yearly catch a fish stock can replace by breeding and growth. It should be used to set the upper limit on fishing quotas.
The points to remember
- A fish stock is renewable natural capital; each year's natural increase is its natural income.
- Take no more than the natural increase and the stock stays the same size.
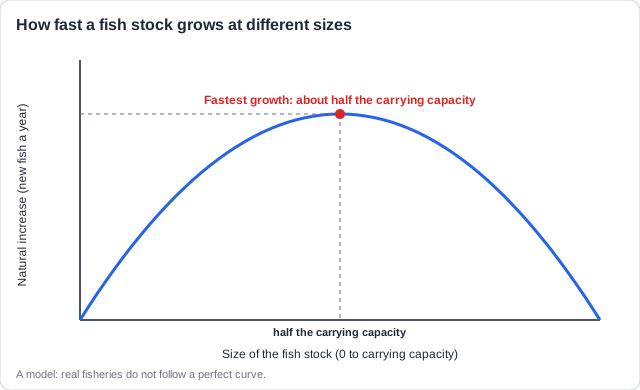
- A stock grows fastest when it is about half its maximum size (the carrying capacity).
- So the MSY is the natural increase of a stock kept at about half its natural size.
- Quotas should be set at or below the MSY: it is a cap, not a target.
Remember it as: Spend the interest, keep the savings.
Example (HL): Alaska pollock. The pollock of the Bering Sea, used for fish fingers, are managed with catch limits set below the scientists' estimate of the sustainable catch, under a cap of 2 million tonnes a year for all groundfish. The stock has stayed large for decades.
Never wonder what to study next
Get a personalized daily plan based on your exam date, progress, and weak areas. We'll tell you exactly what to review each day.
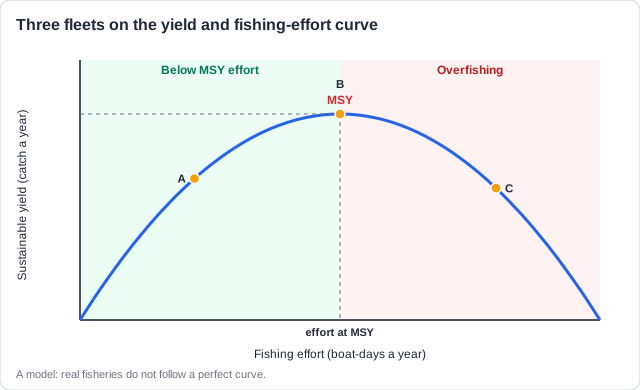
The yield and fishing-effort graph shows what happens to the catch a fishery can sustain as more boats fish for longer. Fishing effort goes along the bottom; the sustainable yield goes up the side.
The points to remember
- Low effort: few fish caught; the stock stays big; yield is below the MSY.
- More effort raises the yield up to a peak: the MSY, at the effort at MSY.
- Beyond that effort, the stock is fished down so far that the yield falls: overfishing.
- The same yield is found at two efforts; the lower one is cheaper and safer for the stock.
- To draw it: label both axes, draw a dome, mark MSY at the top with dotted lines to the effort axis.
Reading the graph (HL). Fleets A and C land about the same sustainable catch. A uses little effort and leaves a large stock; C spends far more on boats and fuel and keeps the stock small and at risk. Cutting C's effort back to B would raise its catch while costing less.
To use the MSY, scientists estimate it, the government sets a total allowable catch at or below it, and shares that out as quotas.
Strengths of MSY
- A clear, science-based limit for setting quotas.
- Keeps the stock in balance, so it goes on giving food and income.
- Protects the ecosystem services the stock supports.
Limits of MSY
- Needs accurate data on stock size and breeding, which is hard and costly.
- Migrating fish are hard to count.
- A one-species model: ignores the food web and bycatch.
- Breeding varies with ocean conditions (El Niño), so the MSY changes.
- Smaller catches mean less income at first.
The points to remember
- MSY needs data on population size and reproductive rate (how fast it recovers).
- To evaluate it, give both strengths and limits; one side only is capped.
- Many managers now aim a little below the MSY to leave a safety margin.
Example (HL): Alaska pollock again. Yearly surveys by research ships, observers on every large boat and records of every landing give the data MSY needs. Even so, warm years in the Bering Sea have cut the number of young pollock, so the limits have had to change.
Stop wasting time on topics you know
Our AI identifies your weak areas and focuses your study time where it matters. No more overstudying easy topics.
Fishing at the MSY usually needs far less fishing than happens in practice. Many fleets fish well to the right of the peak. Why?
The points to remember
- Open access: no one owns the fish, so each boat takes all it can (the tragedy of the commons).
- Too many boats: fleets built up with loans and subsidies must keep fishing to pay them back.
- Jobs and politics: governments set quotas above scientific advice to protect fishing towns.
- Uncertain data: stocks are overestimated, so the MSY is set too high.
- Illegal fishing and discarded fish are not counted.
- High prices for scarce fish make it pay to keep fishing.
Remember it as: Free fish, big fleets, short-term votes.
Example (HL): Atlantic bluefin tuna, 2007. Scientists advised a catch of about 15 000 tonnes. Governments set the quota at 29 500 tonnes, and with illegal fishing the real catch was estimated at about 61 000 tonnes: around four times the advice.
MSY is a cap, not a goal: A quota set exactly at an uncertain MSY leaves no room for error. If the estimate is too high, or a bad year cuts breeding, fishing at the 'MSY' overfishes the stock.
How this comes up: Paper 2 can give the yield and fishing-effort graph and ask you to explain what it shows; Paper 1 asks you to evaluate MSY for a named fishery [3].
The graph shows the sustainable yield of a fish stock at different levels of fishing effort, with three fleets, A, B and C.
Explain why fleet C is overexploiting the stock even though its yield is similar to that of fleet A.
Model answer plan
See the mark-by-mark plan — for / against / judgement, with marking guidance — in study mode.