Access to freshwater at Higher Level: Who gets freshwater is decided as much by people as by rain. At HL you meet Kuwait's desalinated water, Bolivia's vanishing glaciers, a water war in Cochabamba and the Indus Waters Treaty, and you weigh all four kinds of human factor in one answer.
Practise this as you read
- Link every climate-change point to its effect on freshwater.
- Explain each factor with a named place: social, cultural, economic, political.
Free preview
This is the free notes preview
You're reading the free notes. Aimnova Pro unlocks the full study experience — and you can try it with your first topic free to keep:
- FlashcardsLock in vocabulary and key terms with spaced repetition.
- Practice questionsAnswer exam-style questions and get instant AI marking.
- Mock exams & past-paper vaultSit full mocks and see exactly how examiners award marks.
- Personalised study planA daily plan built around your exam date and weak areas.
Mostly salt, mostly ice, mostly far away: Only a tiny share of Earth's water is fresh and easy to reach, and it is spread very unevenly. Having water nearby is not the same as equitable access to it.
The points to remember
- About 97.5% of Earth's water is salt; only about 2.5% (often rounded to 3%) is fresh.
- Of the freshwater, about 69% is ice, 30% is groundwater and only about 1% is in lakes, rivers and soil.
- Much groundwater is deep and costly to pump; much river water is in remote places such as the Amazon and Siberia.
- So freshwater per person differs hugely between countries: availability is uneven.
- Who actually gets it depends on social, cultural, economic and political factors.
Remember it as: Mostly salt, mostly ice, mostly in the wrong place.
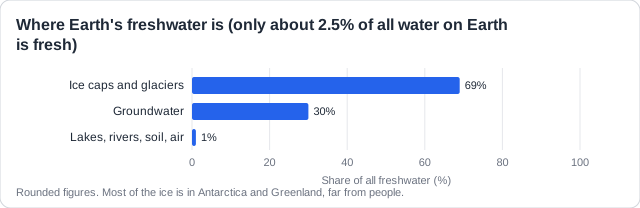
Groundwater is pumped from aquifers. The water that rain and snow refill each year is called renewable freshwater.
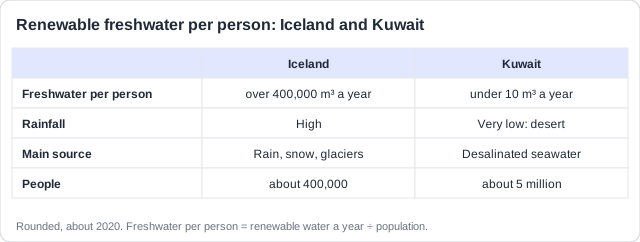
Real example: Iceland has over 400,000 m³ of renewable freshwater per person each year; Kuwait has under 10, so it makes most of its drinking water from seawater.
Learn what examiners really want
See exactly what to write to score full marks. Our AI shows you model answers and the key phrases examiners look for.
Nature sets the starting amount: A place's climate and its water stores decide how much freshwater it has. Climate change is now changing both.
The points to remember
- High precipitation and low evaporation (a cool, wet climate) give a place more freshwater.
- Large stores that refill (lakes, rivers, glaciers, aquifers) keep water flowing through dry seasons.
- Higher temperatures mean more evaporation: drier soils, shrinking lakes, saltier water, even desertification.
- Changed rainfall or more El Niño events: more water in some places, more droughts in others.
- Rising sea levels: seawater floods or seeps into coastal groundwater and makes it salty.
- Melting glaciers: in the short term more water in rivers; in the long term less, as the ice runs out.
Remember it as: Glaciers: short term more, long term less.
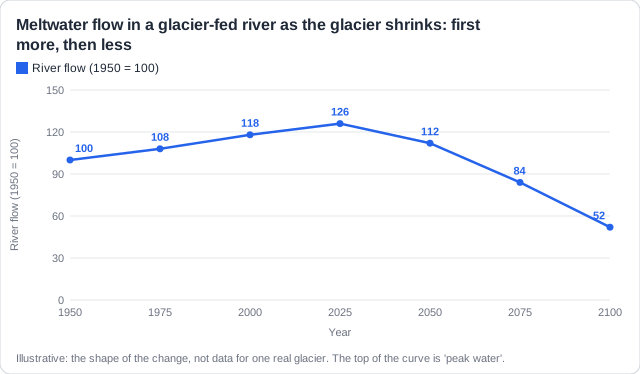
Real example: in Bolivia, the Chacaltaya glacier above La Paz had melted away completely by 2009. Glaciers supply part of the water for La Paz and El Alto in the dry season, and in the 2016 drought La Paz had to ration water.
Two traps, and one rule: Each point needs the change (warmer, less rain, rising seas) and its effect on freshwater. 'Climate change causes problems' scores nothing.
Never write 'glacier retreat causes flooding', and never say the extra water comes from 'snowmelt': it is the glacier ice melting.
Papers often give a table of ice volume and ask for a percentage decrease. Write the formula first: percentage decrease = (old value − new value) ÷ old value × 100.
Worked example: Practice numbers: a glacier held 64 km³ of ice in 1950 and 40 km³ in 2020.
(64 − 40) ÷ 64 × 100 = 24 ÷ 64 × 100 = 37.5% decrease. Divide by the old value, and give the % sign.
People, habits and beliefs: How many people there are, how they live and what they believe all change how much clean water there is, and who gets it. Social factors and cultural factors work together.
The points to remember
- Social: fast population growth and growing cities raise demand faster than pipes can be laid.
- New city homes are often in informal settlements with no piped water: people use wells or buy from sellers.
- Education and awareness: people who know how to save and protect water use it better.
- Gender roles: where women and girls fetch water, they lose hours each day, so access is not equal.
- Cultural: habits and beliefs decide how much water people use, and how they treat rivers and lakes.
- Religious rituals, such as mass bathing in a sacred river, can pollute it, so less is safe to drink.
- Culture can also help: old traditions of sharing water fairly between users.
Remember it as: More people, new homes, old habits: all change who gets the water.
Social, real example: in Singapore, years of campaigns have made saving water a national habit. Each person at home used about 141 litres a day in 2023, and the target is 130 by 2030.
Cultural, real example: the Ganges is sacred to Hindus. Millions bathe in it at festivals, and offerings, ashes and sewage pollute it. India's Namami Gange programme, begun in 2014, aims to clean it.
Name the factor, then the link: Say which kind of factor it is, then how it changes availability (how much usable water) or access (who can get it).
Never wonder what to study next
Get a personalized daily plan based on your exam date, progress, and weak areas. We'll tell you exactly what to review each day.
Money moves water: Water falls from the sky for free, but storing, cleaning and piping it costs money. Economic factors decide who can pay.
The points to remember
- Richer countries can pay for dams, pipes, treatment works and desalination plants.
- In poorer places the water may be there, but there is no money to pipe and clean it.
- Price: the poorest may not afford enough, and often pay more per litre than homes on the mains.
- Privatisation: a company runs the supply; it may invest, but prices can rise beyond what poor families can pay.
- Farms and industry take water and pollute it, leaving less clean water for homes.
- Polluted water is not usable without costly treatment, so less is available even if the volume is the same.
Remember it as: Rain is free; pipes are not.
Real example: in Cochabamba, Bolivia, the city's water supply was privatised in 1999. Bills rose sharply, mass protests followed in 2000, and the contract was cancelled.
Not just 'they are poor': Link money to something specific: no pipes, no treatment works, or water too expensive to buy.
Who controls the tap: Political factors decide who controls water. About 60% of the world's river flow crosses a national border, so many countries share their water.
The points to remember
- A country upstream can build dams or take water, so less reaches countries downstream.
- A treaty fixes each country's share; without a binding agreement, no share is guaranteed.
- Shared water can bring conflict: disputes, threats, and people who migrate when water runs out.
- It can also bring cooperation: joint commissions, shared data, shared dams and hydropower.
- Governance at home: laws against pollution, fair rules for sharing; corruption leaves pipes unbuilt.
- War and unrest can destroy pumps, pipes and treatment works and cut the supply.
Remember it as: Upstream holds the tap; a treaty shares it.
Conflict
- An upstream dam cuts the flow downstream.
- No treaty, so no guaranteed share.
- Shortage can push people to migrate.
Cooperation
- A treaty fixes each share.
- Joint commissions share river data.
- Shared dams give both sides hydropower.
Real example: the Indus Waters Treaty of 1960 shared the Indus rivers between India and Pakistan: India got the three eastern rivers, Pakistan the three western ones. It survived several wars, but in 2025 India said it was putting the treaty on hold.
Show both sides: A long answer on shared water needs conflict and cooperation, each with a named river.
Stop wasting time on topics you know
Our AI identifies your weak areas and focuses your study time where it matters. No more overstudying easy topics.
Plenty of water, few people, careful use: Some countries are unlikely to run short: they have lots of water, few people to share it, or the money and values to use it well. Ecocentric values help too.
The points to remember
- Climate: high precipitation and low evaporation.
- Large replenishable stores: lakes, rivers, glaciers and aquifers that refill each year.
- Money and technology: water harvesting, desalination and treatment add supply.
- Ecocentric values: people use water sustainably and pollute little.
- No conflicts with neighbours over shared water sources.
- Low population density: less demand from homes, farms and industry.
- A low standard of living: fewer appliances and less industry, so lower demand per person.
Remember it as: Lots of rain, big stores, few people, careful use, no fights.
Real example: New Zealand has heavy rain on its western mountains, about 5 million people, and no river shared with another country. In 2017 a law made the Whanganui River a legal person, following the Māori view of the river as an ancestor: an ecocentric value.
Say why it lowers the risk: One reason per mark, each with its link: not 'it is rich' but 'it can afford desalination'. A low standard of living counts too: less use per person means lower demand.
How this comes up: Paper 2, Section B (b): explain, with named examples, how human factors affect access to freshwater [7].
Freshwater is shared very unevenly, both between countries and between people in the same country.
Using named examples, explain how social, cultural, economic and political factors can affect access to freshwater.
Model answer plan
See the mark-by-mark plan — for / against / judgement, with marking guidance — in study mode.