Abiotic factors and biomes at Higher Level: The same ideas as SL, with different places: Queensland to Alice Springs, Darwin, Yakutsk, Hawaii and Tenerife. HL goes on to biomes that do not match the prediction (2.4.9).
Practise this as you read
- Plot a place on the biome graph from its two numbers.
- Link each abiotic factor to a named biome.
Free preview
This is the free notes preview
You're reading the free notes. Aimnova Pro unlocks the full study experience — and you can try it with your first topic free to keep:
- FlashcardsLock in vocabulary and key terms with spaced repetition.
- Practice questionsAnswer exam-style questions and get instant AI marking.
- Mock exams & past-paper vaultSit full mocks and see exactly how examiners award marks.
- Personalised study planA daily plan built around your exam date and weak areas.
The climate decides the biome: Abiotic factors decide which biome develops on land. It is the climate, the long-term average, not one day's weather, that does it.
The points to remember
- Abiotic factors are the determinants of where land biomes are found.
- The main ones are temperature and precipitation, with insolation (sunlight energy).
- Together they set the water and energy available for photosynthesis.
- They decide the soil and the plants; the plants decide which animals can live there.
- For any temperature and rainfall pattern, one natural ecosystem type is likely to develop.
- Warm and wet: dense forest. Dry: grassland or desert. Cold: slow growth, tundra or taiga.
Remember it as: Water and warmth decide the plants; the plants decide the animals.
Real example: from the Daintree rainforest on the Queensland coast (over 2,000 mm of rain a year) inland to Alice Springs (about 280 mm), Australia's biome changes from tropical rainforest to savanna to hot desert, as rainfall falls.
Factor plus effect: Name the factor and what it does: 'low temperature slows photosynthesis', not just 'temperature'. If temperature or rainfall changes, the biome boundaries shift too.
Practice with exam-style questions
Answer exam-style questions and get AI feedback that shows you exactly what examiners want to see in a full-marks response.
The biome graph puts the two main factors together. Each area is one biome.
How to use the biome graph
- Across: mean annual temperature (°C). Up: annual precipitation (mm).
- Plot the place's two numbers: the area the point falls in is its likely biome.
- Hot and very wet: tropical rainforest. Hot and dry: hot desert.
- Coldest: tundra; a little warmer: boreal forest. Mild and wet: temperate forest.
- Mean annual temperature = the 12 monthly means added up, divided by 12.
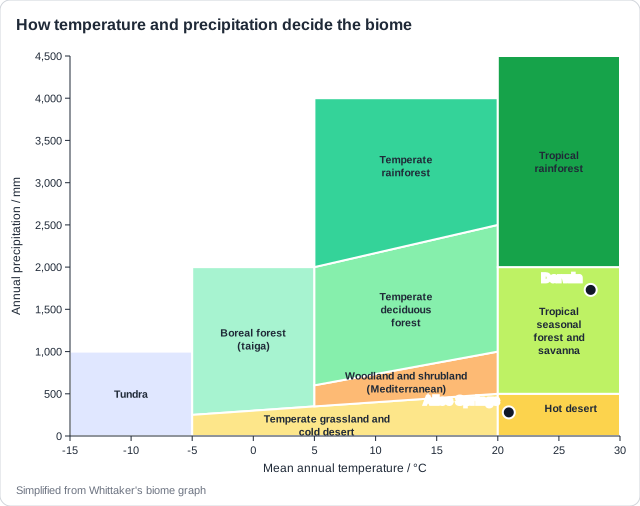
Real example: Darwin, Australia, averages 27.6 °C and about 1,730 mm, mostly in a wet season, so it plots in tropical seasonal forest and savanna. Alice Springs averages 20.9 °C and 280 mm: hot desert.
Name it in full: Give the biome's full name from the chart, and only one answer. Near a boundary, quote both values to show which side the point falls on.
Each abiotic factor can be a limiting factor. Where one is scarce, productivity is low and the biome is simple.
How the climate limits productivity
- Low temperature slows enzymes and photosynthesis, and the growing season is short.
- Below 0 °C water freezes, so roots cannot take it up; permafrost blocks roots and drainage.
- Low precipitation gives too little water for photosynthesis: plants are small and far apart.
- Low insolation (a low sun and short winter days) gives little energy for photosynthesis.
- Warm, wet and sunny all year gives the highest productivity: tropical rainforest.
| Factor | Yakutsk, Siberia | Effect |
|---|---|---|
| Temperature | About -38 °C in January | Growth only in a short summer |
| Water | About 240 mm a year; frozen in winter | Little water plants can use |
| Insolation | About 5 hours of daylight in December | Little energy in winter |
| Ground | Permafrost hundreds of metres deep | Shallow-rooted larch trees only |
Real example: Yakutsk lies in the taiga. Its larch trees drop their needles for the frozen winter and grow only in the short summer, so productivity is far lower than in a temperate forest.
Use the data you are given: Tie each way to the data: 'below 0 °C for five months, so water is frozen'. 'High rainfall' is never a reason a cold biome is unproductive.
Feeling unprepared for exams?
Get a clear study plan, practice with real questions, and know exactly where you stand before exam day. No more guessing.
Water is the factor that differs most from region to region. How much falls, how much evaporates, and how much stays frozen decide the biome.
Water and the biome
- Tropics with high rainfall and transpiration all year: tropical rainforest.
- Where evaporation exceeds precipitation, water limits growth: desert.
- Near the poles most water is frozen (ice, permafrost), so little is left for plants: tundra.
- Mid-latitudes with moderate rain and transpiration: temperate forest or grassland.
- Where water inputs exceed outputs, or the water table is high: wetland.
- Mountains: the windward side is wet (forest); the leeward side is in a rain shadow (dry).
| Place | Rain a year | Biome |
|---|---|---|
| Hilo (east, windward) | About 3,200 mm | Tropical rainforest |
| Kawaihae (west, leeward) | About 250 mm | Dry grassland and scrub |
Real example: on Hawaii's Big Island, trade winds rise over the eastern slopes and drop their rain on Hilo. The west coast lies in a rain shadow, so the land there is dry scrub.
Link every point to a biome: In a longer answer, pair each water fact with the biome it produces: 'evaporation exceeds precipitation, so water limits growth and a desert forms'. Facts with no biome score less.
On a mountain the temperature falls as you climb, so the vegetation changes in bands. A vegetation map read with an elevation map shows it.
Altitude and maps
- Climbing a mountain is like travelling towards a pole: it gets colder, so biomes change in bands.
- The highest land has the coldest biome: alpine grassland, scrub, or bare rock and ice.
- Use two maps together: find the highest zone on the elevation map, then read its vegetation.
- Name the vegetation exactly as the key does: 'subtropical rainforest', not 'rainforest'.
Tenerife, Canary Islands, from coast to summit
Coast
Dry scrub of spurges and cactus-like plants.
600-1,200 m, north side
Laurel forest in the belt of cloud.
1,200-2,000 m
Canary pine forest.
Above 2,000 m
High-mountain broom scrub.
Teide, 3,715 m
Bare volcanic rock.
Real example: Tenerife climbs from dry coastal scrub to the bare rock of Mount Teide. The laurel forest grows only on the north side, where the trade winds bring a belt of cloud.
Copy the key exactly: If the highest zone is 'grassland and woodland', give both words. 'Forest' alone, or 'rainforest' when the key says 'subtropical rainforest', is too vague.
Memorize terms 3x faster
Smart flashcards show you cards right before you forget them. Perfect for definitions and key concepts.
You may be asked to draw a climate graph for a biome from a table of monthly data. It uses the same layout as the graphs in the papers.
Drawing a climate graph
- Draw 12 bars for monthly precipitation, on a left axis in mm.
- Plot 12 points for mean monthly temperature on a right axis in °C, and join them.
- Label the months, both axes with units, and give a title naming the place.
- Add the total precipitation and the mean temperature: they place it on the biome graph.
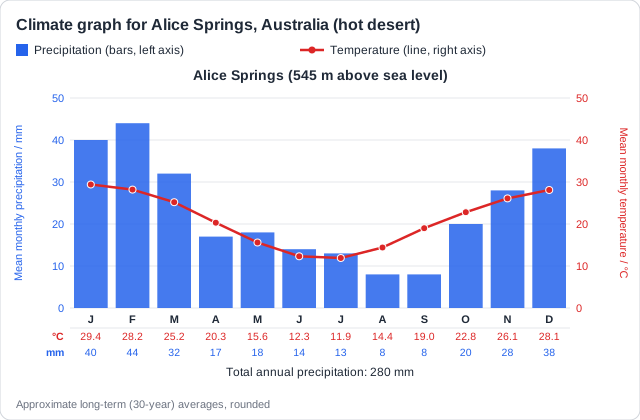
Real example: Alice Springs's graph shows the hot desert pattern: short bars in every month, only 280 mm a year, and a line rising to 29.4 °C in the southern summer.
Two axes, two scales: Choose a scale for each axis that uses most of the height, and start the temperature axis below zero if any month is below freezing.
How this comes up: Paper 2, Section B (a): distinguish two named biomes and the factors that cause their distribution [4].
Hot deserts and temperate deciduous forests cover large areas of the Earth.
Distinguish between hot desert and temperate deciduous forest and the factors that cause their distribution.
Model answer plan
See the mark-by-mark plan — for / against / judgement, with marking guidance — in study mode.