Plant tissue at Higher Level: The same practical as SL. At HL you also explain the results with solute and pressure potential (4.6.11).
Practise this as you read
- State the independent variable of an osmosis investigation.
- Suggest why mass changes are given as percentages.
Free preview
This is the free notes preview
You're reading the free notes. Aimnova Pro unlocks the full study experience — and you can try it with your first topic free to keep:
- FlashcardsLock in vocabulary and key terms with spaced repetition.
- Practice questionsAnswer exam-style questions and get instant AI marking.
- Mock exams & past-paper vaultSit full mocks and see exactly how examiners award marks.
- Personalised study planA daily plan built around your exam date and weak areas.
Start Studying Free Full access to Aimnova Pro · cancel anytime
The big idea: Plant tissue gains mass and length in hypotonic solutions and loses them in hypertonic ones. The concentration that causes no change is isotonic to the tissue.
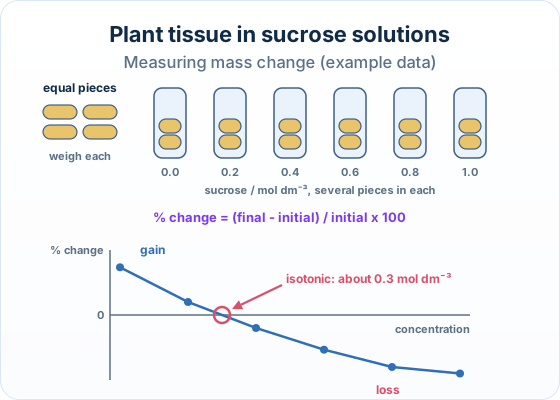
The points to remember
- The independent variable is the solute concentration; the dependent variable is the change in mass (or length).
- Pieces of the same size and shape have the same surface area for water to cross.
- Use percentage change, because the pieces start with slightly different masses.
- Gain = water moved in (hypotonic); loss = water moved out (hypertonic).
- Read the isotonic concentration where the line crosses 0 %.
Remember it as: Zero change = isotonic.
Real example: beetroot. Beetroot pieces of similar size and shape are a common choice for this investigation, because the tissue is firm and easy to cut into equal pieces.
Study smarter, not longer
Most students waste 40% of study time on topics they already know. Our AI tracks your progress and optimizes every minute.
Try Smart Study FreeYour first topic is free to keep • No credit card required
Making the results reliable: Control everything except the solute concentration, repeat each concentration, and show the spread.
| What you do | Why |
|---|---|
| Same size and shape of pieces | Same surface area, so the same rate of water movement |
| Same time, same temperature | Both affect how much water moves |
| Blot each piece the same way | Surface water would add to the mass |
| Several pieces per concentration | A mean is more reliable than one piece |
| Percentage change | Pieces with different starting masses can be compared |
- Standard deviation
- How spread out the repeat results are around the mean.
- Standard error
- How reliable the mean is: it gets smaller as more repeats are done. You do not need to remember the formula.
- Error bars
- Lines above and below a mean showing its standard deviation or standard error.
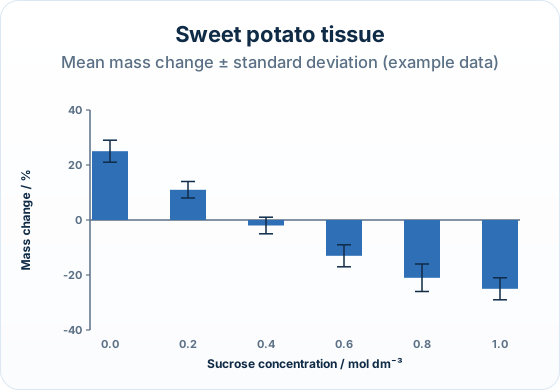
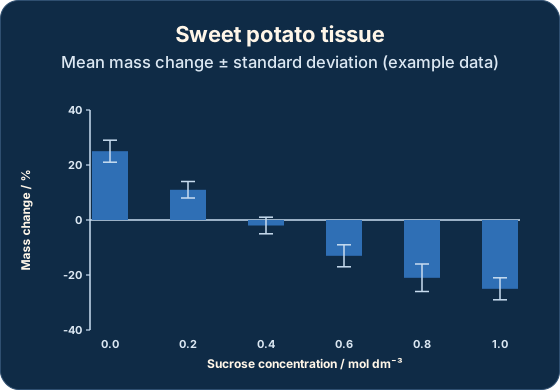
Reading error bars: If the error bars of two means overlap, the difference between them may not be significant. If they do not overlap, the difference is more likely to be real.
How it is asked: Paper 1 data questions on this practical: name the variables, explain the control of size and shape, give a reason for percentages, identify the type of graph, estimate the isotonic concentration and compare two concentrations on a box-and-whisker plot.
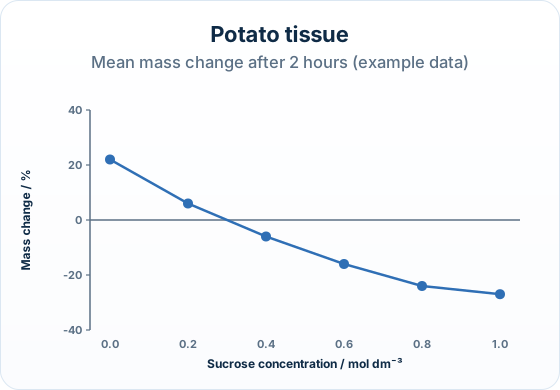
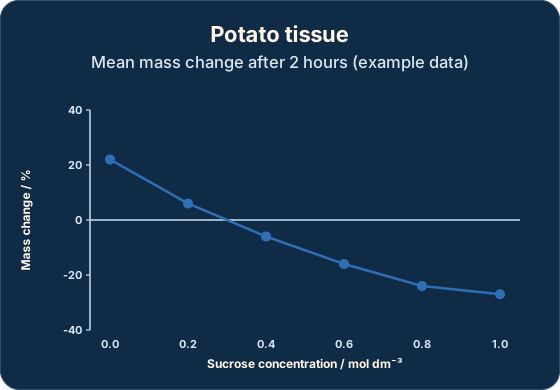
IB-style questionEstimate[2 marks]
Using the graph of mean mass change, estimate the sucrose concentration that is isotonic to the tissue, and explain how you found it.
Model answer plan
See the answer broken into clear points, with guidance on how each point earns marks.
Box-and-whisker words: On a box-and-whisker plot the line in the box is the median, not the mean, and the lines are whiskers, not error bars.