Biome distribution at Higher Level: The same statement as SL. HL questions give a biome graph to read, ask what its axes show, or ask which abiotic variables decide between two biomes.
Practise this as you read
- Identify the abiotic variables that decide a biome.
- Deduce a biome from temperature and rainfall.
Free preview
This is the free notes preview
You're reading the free notes. Aimnova Pro unlocks the full study experience — and you can try it with your first topic free to keep:
- FlashcardsLock in vocabulary and key terms with spaced repetition.
- Practice questionsAnswer exam-style questions and get instant AI marking.
- Mock exams & past-paper vaultSit full mocks and see exactly how examiners award marks.
- Personalised study planA daily plan built around your exam date and weak areas.
Scientists classify biomes by plotting the two factors that matter most — temperature and precipitation — on a chart with temperature on one axis and rainfall on the other.
Each biome occupies its own region of that chart, so a place's climate values point to a single biome.
| Abiotic factor | What the axis usually shows | Effect on the biome |
|---|---|---|
| Temperature | Mean annual temperature (hot at one end, cold at the other) | Sets which plants can grow and how fast; cold limits the tundra |
| Precipitation | Mean annual rainfall (wet at one end, dry at the other) | Sets water availability; low rainfall gives deserts, high rainfall gives rainforest |
Follow the two axes from one extreme to the other
- Hot + very dry → hot desert.
- Hot + very wet → tropical rainforest.
- Moderate temperature + moderate-to-high rainfall → temperate forest.
- Moderate temperature + a drier season → grassland.
- Cold + low rainfall → tundra.
How the two factors sort the biomes: So two numbers — a temperature and a rainfall — are enough to place a region into a biome.
Each biome sits in a region of the temperature–rainfall climate space. Read off a point's temperature and rainfall to find its biome.
Interactive diagram
Explore the labelled diagram, charts and maps for this topic in full study mode.
| Biome | Temperature | Precipitation (rainfall) | Typical vegetation |
|---|---|---|---|
| Hot desert | Hot | Very low | Sparse, drought-adapted plants (e.g. succulents) |
| Tropical rainforest | Hot | Very high | Dense, tall, evergreen broadleaf trees |
| Temperate forest | Moderate (warm summers, cool winters) | Moderate to high | Deciduous broadleaf trees |
| Grassland | Moderate | Moderate (a dry season) | Grasses, few trees |
| Tundra | Cold | Low | Low mosses, lichens and small shrubs |
Temperature axis
- Runs from hot to cold
- Hot end → deserts and rainforest
- Cold end → tundra
- Sets which plants can survive and how fast they grow
Precipitation axis
- Runs from wet to dry
- Wet end → tropical rainforest
- Dry end → desert
- Sets how much water is available to organisms
Climate decides the community: A biome's climate decides its vegetation, and the vegetation decides which animals can live there.
That is why hot, wet rainforest is packed with tall evergreen trees and huge biodiversity, while cold, dry tundra has only low mosses, lichens and small shrubs — the same two abiotic factors explain both.
An easy way to remember: Two axes, two questions: how HOT? how WET?
Hot + wet = rainforest; hot + dry = desert; cold = tundra. Everything in between (temperate forest, grassland) sits in the moderate middle.
Practice with exam-style questions
Answer exam-style questions and get AI feedback that shows you exactly what examiners want to see in a full-marks response.
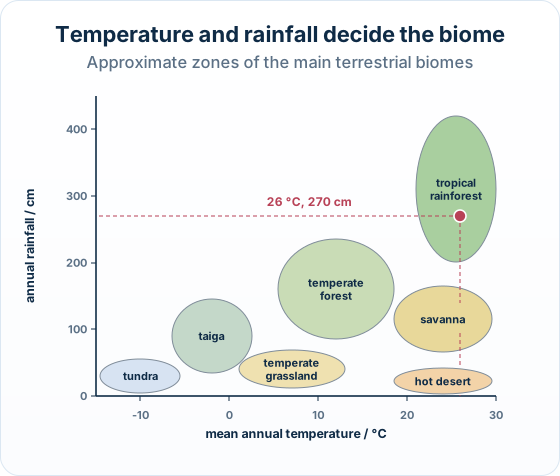
The big idea: For any pattern of temperature and rainfall, one natural ecosystem type is likely to develop. A biome graph shows which.
The points to remember
- The horizontal axis is usually mean annual temperature; the vertical axis annual rainfall.
- Cold, left: tundra, then taiga. Hot, right: hot desert, savanna, tropical rainforest.
- At the same temperature, rainfall decides: dry gives grassland or desert, wet gives forest.
- Read both values of a point before naming the biome.
Remember it as: Across = how hot; up = how wet.
Real example: Manaus. Manaus in Brazil has a mean annual temperature of about 27 °C and about 230 cm of rain a year: on the graph it falls in the tropical rainforest zone, in the middle of the Amazon rainforest.
Trap: Temperate forest and temperate grassland have similar temperatures: only the rainfall tells them apart.
How this is tested: Expect a biome graph to read in a multiple-choice question, or a short State or Explain question.
| Question | What it asks | How to answer |
|---|---|---|
| Multiple-choice graph question | A graph with temperature on one axis and precipitation on the other, with points (or shaded zones) for different biomes. Identify which point represents a named biome such as temperate forest. | Read both coordinates of a point and match them to the biome whose climate fits — moderate temperature and moderate-to-high rainfall for temperate forest. |
| Short answer | State the two abiotic factors used to classify biomes, or explain why a biome's climate gives it its characteristic vegetation. | Temperature and precipitation; link the climate to the vegetation. |
Exam-style question — read a temperature-vs-precipitation biome graph
A biome graph plots mean annual temperature on the x-axis and mean annual precipitation on the y-axis. Four points are marked: P (hot, very dry), Q (hot, very wet), R (moderate temperature, moderate-to-high rainfall) and S (cold, low rainfall). Identify which point represents temperate forest. [1]
How to read the graph
- Recall the climate of a temperate forest. It has a moderate temperature (warm summers, cool winters) and moderate-to-high rainfall — not extreme on either axis.
- Read each point's two coordinates. P is hot and very dry (a hot desert); Q is hot and very wet (tropical rainforest); S is cold with low rainfall (tundra).
- Match the moderate-moderate point. Only point R has a moderate temperature with moderate-to-high rainfall, so R is the temperate forest.
Final answer
Point R — it has a moderate temperature with moderate-to-high rainfall, which is the climate of a temperate forest.
Why this works: The trick is to read both coordinates of each point, not just one.
Temperate forest is the middle climate — moderate on both axes — so you find it by ruling out the extremes (hot/dry, hot/wet and cold) and taking what is left.
| Biome | Temperature | Precipitation (rainfall) | Typical vegetation |
|---|---|---|---|
| Hot desert | Hot | Very low | Sparse, drought-adapted plants (e.g. succulents) |
| Tropical rainforest | Hot | Very high | Dense, tall, evergreen broadleaf trees |
| Temperate forest | Moderate (warm summers, cool winters) | Moderate to high | Deciduous broadleaf trees |
| Grassland | Moderate | Moderate (a dry season) | Grasses, few trees |
| Tundra | Cold | Low | Low mosses, lichens and small shrubs |
Another question in the papers' style:
A region has a mean annual temperature of 8 °C and 40 cm of rain a year. Deduce which biome is likely to develop there.
Model answer plan
See the answer broken into clear points, with guidance on how each point earns marks.