Human inputs to city air: Cities add pollutants to the air faster than the wind and rain can remove them. Think of the air above a city as a system with inputs and outputs.
The points to remember
- Urban air pollution is caused by inputs from human activities to the atmospheric system.
- The main inputs: nitrogen oxides (NOₓ), sulfur dioxide (SO₂), carbon monoxide (CO) and particulate matter (PM).
- Almost all come from burning: fuel in engines, power stations, factories and home fires.
- Outputs: the wind blows pollution away and rain washes it out.
- On still, dry days the inputs are bigger than the outputs, so pollution builds up.
- Cities pack traffic, homes and industry together, so the inputs are concentrated.
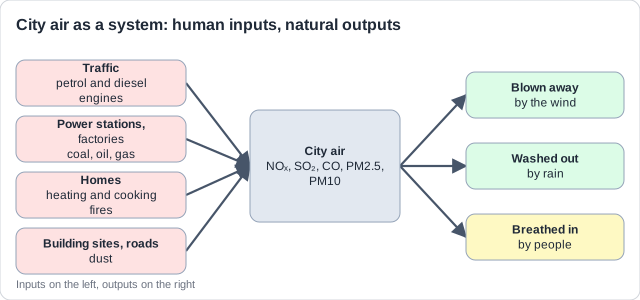
Remember it as: Burn more, blow less: still air lets the city's smoke pile up.
Real example: every winter, Delhi's millions of vehicles, coal power stations and fires pour pollutants into cold, still air. With almost no wind or rain to remove them, PM2.5 often passes 300 micrograms per m³, about 20 times the WHO 24-hour guideline.
Free preview
This is the free notes preview
You're reading the free notes. Aimnova Pro unlocks the full study experience — and you can try it with your first topic free to keep:
- FlashcardsLock in vocabulary and key terms with spaced repetition.
- Practice questionsAnswer exam-style questions and get instant AI marking.
- Mock exams & past-paper vaultSit full mocks and see exactly how examiners award marks.
- Personalised study planA daily plan built around your exam date and weak areas.
The guide names four pollutants that human activities add to city air. All four come from burning fuel, so the same sources often release several at once.
The four main pollutants
- NOₓ (NO and NO₂): from fuel burned at high temperature in engines and power stations; irritates lungs; helps form smog and acid rain.
- SO₂: from burning coal and oil that contain sulfur; irritates airways; forms acid rain. Less common where fuels are clean.
- CO: colourless, odourless and toxic; from incomplete burning, mainly vehicle exhausts; it cuts the oxygen the blood can carry.
- PM: tiny solid or liquid particles: soot, smoke and dust; sorted by size into PM10 and PM2.5.
| Pollutant | Main source | Main harm |
|---|---|---|
| NOₓ | Hot engines, power stations | Lungs; smog; acid rain |
| SO₂ | Coal and oil with sulfur | Airways; acid rain |
| CO | Incomplete burning in exhausts | Less oxygen in the blood |
| PM10, PM2.5 | Soot, smoke, dust | Lungs, heart; dirty buildings |
Real example: the Great Smog of London lasted from 5 to 9 December 1952. Smoke from millions of coal fires filled the cold, still air with soot and sulfur dioxide. About 4,000 people died within days, and later estimates reach 12,000.
Name the pollutant exactly: 'Smoke' or 'fumes' is too vague. Say which pollutant: carbon monoxide, sulfur dioxide, nitrogen oxides, PM2.5 or PM10. Carbon dioxide is a greenhouse gas, not one of the four.
Stop wasting time on topics you know
Our AI identifies your weak areas and focuses your study time where it matters. No more overstudying easy topics.
Particulate matter is sorted by the width of the particles, measured in micrometres.
PM10 and PM2.5
- PM10: particles 10 micrometres across or less (dust, pollen, coarse soot).
- PM2.5: fine particles 2.5 micrometres across or less (soot and smoke from burning).
- A human hair is about 70 micrometres wide: PM2.5 is about 30 times thinner.
- PM10 is mostly stopped in the nose and throat; PM2.5 reaches deep into the lungs and the blood.
- So PM2.5 is the most dangerous: asthma, bronchitis, heart disease and early death.
- PM also dirties buildings and cuts visibility (haze).
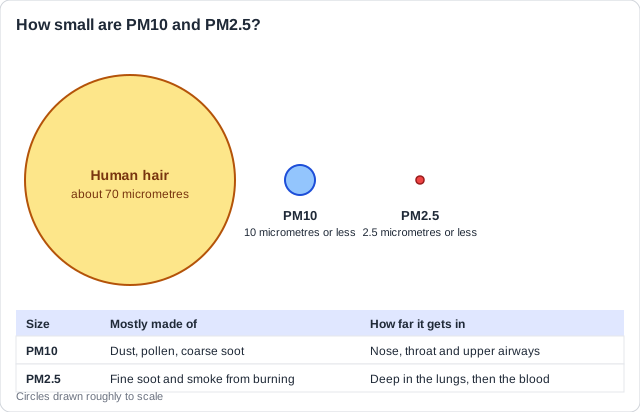
Remember it as: Ten stops in the throat; two and a half gets into the blood.
Real example: in 2013 a nine-year-old London girl, Ella Adoo-Kissi-Debrah, who lived near a busy road, died after a severe asthma attack. In 2020 an inquest found that air pollution, with nitrogen dioxide and PM above safe levels, had contributed to her death: the first such finding in the UK.
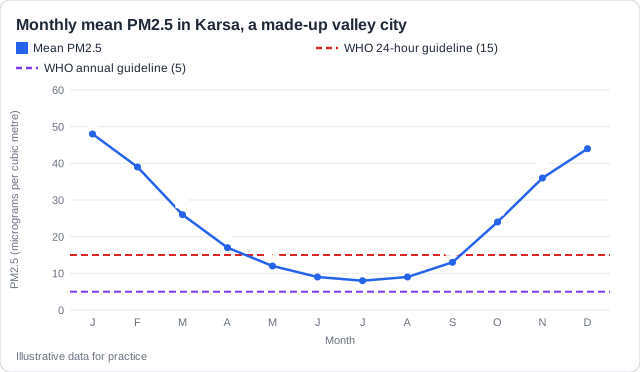
Papers often give a graph of monthly PM2.5 with the WHO guideline drawn on it. You read it, count, calculate, and say why the city measures it.
Reading air-quality data
- WHO 2021 guidelines for PM2.5: 5 micrograms per m³ as a yearly mean; 15 as a 24-hour mean.
- For PM10: 15 a year; 45 over 24 hours. For NO₂: 10 a year; 25 over 24 hours.
- On a graph, count only the points above the guideline line; a point on the line does not exceed it.
- Percentage change = (new - old) / old x 100.
- Cities monitor PM2.5 because it is a key indicator of air quality and harms health.
- The data also guide decisions (warnings, traffic limits) and show damage to buildings and plants.
Real example: Delhi publishes an Air Quality Index from its monitors. When PM2.5 reached 'severe' levels in November 2019, the city declared a public health emergency and closed schools: monitoring led straight to action.
Show the working: Karsa from January (48) to July (8): (8 - 48) / 48 x 100 = -83 %, a fall of 83 %. Always divide by the starting value.
See how examiners mark answers
Answer exam-style questions with model answers. Learn exactly what earns marks and what doesn't.
How this comes up: Paper 1: a line graph of monthly PM2.5 with the WHO guideline, then short parts worth [1] each.
Figure 1 shows the monthly mean PM2.5 in Karsa, a city in a mountain valley.
(a) State the number of months in which PM2.5 exceeded the WHO 24-hour guideline. (b) Outline one reason why PM2.5 is monitored in Karsa.
Model answer plan
See the mark-by-mark plan — for / against / judgement, with marking guidance — in study mode.