Same species, same place, same time: A population is a group of organisms of the same species, living in the same area at the same time, that can interbreed.
The points to remember
- The same species: only one kind of organism is counted.
- The same area: one place with a clear edge, such as one forest or one lake.
- The same time: counted over one period, such as one year.
- Capable of interbreeding: the individuals can meet and mate with each other.
- So a population is an interbreeding unit.
Remember it as: Same species, same place, same time, can breed together.
Real example: the mountain gorillas of the Virunga Mountains, on the borders of Rwanda, Uganda and the Democratic Republic of Congo, are one population: one species, one area, counted in one census, and able to meet and breed.
Give all four parts: A definition that leaves out the area or the time is not complete. Write all four parts.
Free preview
This is the free notes preview
You're reading the free notes. Aimnova Pro unlocks the full study experience — and you can try it with your first topic free to keep:
- FlashcardsLock in vocabulary and key terms with spaced repetition.
- Practice questionsAnswer exam-style questions and get instant AI marking.
- Mock exams & past-paper vaultSit full mocks and see exactly how examiners award marks.
- Personalised study planA daily plan built around your exam date and weak areas.
A species is bigger than a population: it is every individual of that kind, wherever it lives.
The points to remember
- A species is every individual of that kind, wherever it lives.
- A population is the part of a species in one area at one time.
- One species may be one population or many.
- Two groups that are too far apart to meet and mate are two populations.
- Mixing two species (lions and zebras) gives a community, not a population.
Remember it as: Species = everywhere. Population = here and now.
Species
- Every individual, worldwide.
- Example: all the tigers on Earth.
Population
- One area, one time, can interbreed.
- Example: the tigers of one reserve in India.
Real example: mountain gorillas live as two populations about 30 km apart: about 604 in the Virunga Mountains (2016) and about 459 in Bwindi forest in Uganda (2018). They are one species, but the two groups cannot meet to breed.
Learn what examiners really want
See exactly what to write to score full marks. Our AI shows you model answers and the key phrases examiners look for.
Papers often give a graph of a population's numbers and ask you to calculate how much it changed.
Calculating a percentage change
- Read the starting and final numbers from the graph.
- Change = final number minus starting number.
- Percentage change = change ÷ starting number × 100.
- Give the answer with a % sign; a fall gives a negative answer.
- Numbers rise with births and arrivals; they fall with deaths and departures.
Remember it as: Change, divide by the start, times 100.
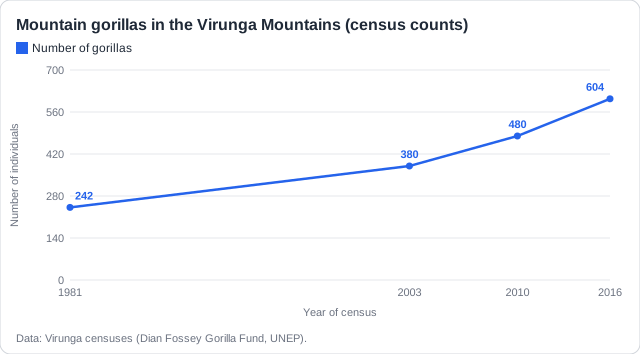
Worked example: from 1981 to 2016 the Virunga gorillas rose from 242 to 604. The change is 604 − 242 = 362. Then 362 ÷ 242 × 100 = 150% (149.6%).
Divide by the starting number: Divide by the number you started with, not the final one, or the answer will be wrong.
You can investigate a population in a local ecosystem, such as your school grounds or a park.
Investigating a local population
- Choose one species that you can recognise.
- Mark out one area with a clear edge, such as a school field or a pond.
- Count at one time, and write down the date and how long you looked.
- If there are too many to count, estimate from samples (later pages show how).
- Record the conditions too, such as temperature, so results can be compared.
Remember it as: One species, one area, one time: then count.
Real example: in the RSPB Big Garden Birdwatch, more than half a million people in the UK each count the birds in one garden for one hour on one weekend in January: one area, one time, so the counts can be compared.
Never wonder what to study next
Get a personalized daily plan based on your exam date, progress, and weak areas. We'll tell you exactly what to review each day.
How this comes up: Paper 1: a graph of a species' numbers; calculate the percentage increase between two years [1].
Figure 1 shows the number of mountain gorillas counted in the Virunga Mountains between 1981 and 2016.
Calculate the percentage increase in the number of gorillas between 2003 and 2016.
Model answer plan
See the mark-by-mark plan — for / against / judgement, with marking guidance — in study mode.