Correlation and causation at Higher Level: Same skills as SL: the skills section is common to both levels. HL Paper 2 data questions ask you to identify a relationship, discuss whether data show a cause, and justify a conclusion using every data set.
Practise this as you read
- Describe a relationship by its direction.
- Comment on r and R².
- Discuss whether a correlation shows a cause.
Free preview
This is the free notes preview
You're reading the free notes. Aimnova Pro unlocks the full study experience — and you can try it with your first topic free to keep:
- FlashcardsLock in vocabulary and key terms with spaced repetition.
- Practice questionsAnswer exam-style questions and get instant AI marking.
- Mock exams & past-paper vaultSit full mocks and see exactly how examiners award marks.
- Personalised study planA daily plan built around your exam date and weak areas.
The big idea: A correlation means two measured variables change together in a pattern.
- Correlation
- A relationship in which two variables tend to change together (positively or negatively).
- Positive correlation
- As one variable increases, the other also increases. The best-fit line slopes upward.
- Negative correlation
- As one variable increases, the other decreases. The best-fit line slopes downward.
- Causation
- A change in one variable directly produces a change in another. Shown by a controlled experiment, NOT by a correlation alone.
- Confounding variable
- A third variable that affects both measured variables and can create a correlation without a direct cause.
- Correlation coefficient (r)
- A number from −1 to +1 measuring the strength and direction of a linear correlation.
- Coefficient of determination (R²)
- r squared — the fraction (or %) of the variation in one variable explained by the other.
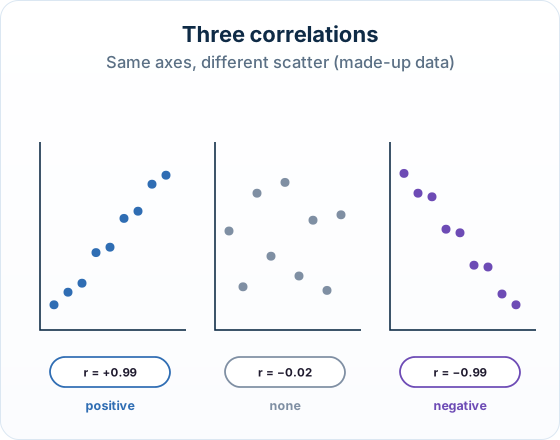
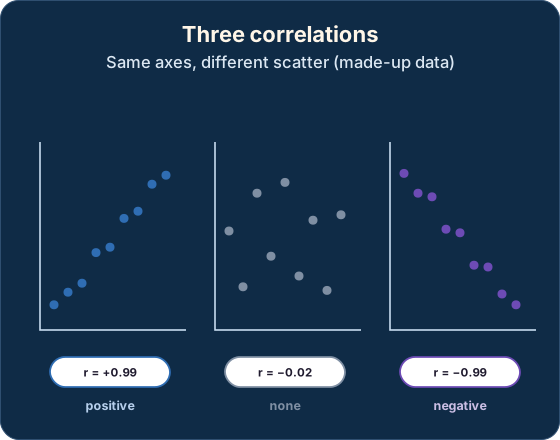
Describing a relationship: Name both variables and the direction: 'as body mass increases, food intake increases' (a positive correlation). Quote numbers from the graph when there are marks to spare.
If the pattern changes part-way, say where: 'both rise until 2010, then the nests level off'. If there are two groups, describe each one: one may rise while the other stays flat.
On a curve or a log-scale graph write positive correlation. 'Directly proportional' needs a straight line through the origin.
| Correlation coefficient r | Strength | Direction |
|---|---|---|
| r ≈ +1 (e.g. +0.9) | Strong | Positive — as x ↑, y ↑ |
| r ≈ +0.5 | Moderate | Positive |
| r ≈ 0 | None / very weak | No linear relationship |
| r ≈ −0.5 | Moderate | Negative — as x ↑, y ↓ |
| r ≈ −1 (e.g. −0.9) | Strong | Negative |
The points to remember
- Positive: both rise. Negative: one rises, the other falls.
- Say the direction with both variables named.
- r runs from −1 to +1: the sign is the direction, the size is the strength.
- r = −0.9 is as strong as r = +0.9.
Get feedback like a real examiner
Submit your answers and get instant feedback — what you did well, what's missing, and exactly what to write to score full marks.
The coefficient of determination: $$R2 = r2$$
R² runs from 0 to 1. It tells you how well the trend line fits the points and what fraction of the variation in the dependent variable is explained by the independent variable.
See it drawn, step by step
In My Learning, handwritten diagrams build one step at a time. Play, pause and replay each explanation until it clicks. Create your free account to try it.
Putting an R² value into words: Turn it into a percentage and name both variables: 'R² = 0.92: 92 % of the variation in transmission speed is explained by axon diameter.'
Then judge it: close to 1 means the points lie close to the line, a strong relationship. The remaining 8 % comes from other factors.
| Correlation coefficient r | Coefficient of determination R² | |
|---|---|---|
| Range | −1 to +1 | 0 to 1 (often given as a %) |
| Tells you | Strength AND direction of the linear relationship | What FRACTION of the variation in y is explained by x |
| Sign | Can be + or − | Always positive (it is r squared) |
| Link | — | R² = r² (so r = ±√R²) |
| Example | r = +0.9 | R² = 0.81 → ~81% of the variation in y is explained by x |
R² is still only a correlation: A high (say 0.92) sounds powerful — 92% of the variation explained — but it is still a correlation.
It does not prove x causes y. A confounding variable could explain that 92% just as well. Strength of a correlation and proof of causation are different things.
How it is asked: Paper 1B and the Paper 2 data question ask you to describe or identify a relationship, comment on an R² value, deduce or discuss whether one variable causes another, evaluate a claim, or justify a conclusion using all the data.
Two groups of hens were compared (made-up data). The high-laying group laid 26 eggs a month and had low expression of gene T; the low-laying group laid 18 eggs and had high expression. Discuss whether the data show that gene T controls egg laying.
Model answer plan
See the answer broken into clear points, with guidance on how each point earns marks.
Evaluating a claim from data
What supports it
A strong correlation, a large sample, data over many years or many sites.
What weakens it
Correlation is not causation; other factors (age, income, weather) are not controlled; no significance test; one group breaks the pattern.
What would settle it
A controlled experiment that changes one variable, or a known mechanism.
Your judgement
Say how far the data support the claim, with the numbers.
Two traps in data questions: Percentages are not numbers. A species can rise from 20 % to 45 % of a sample while its numbers fall, if the whole sample shrank.
Use all the data. When a question says 'using all the data', take a point from each graph or table and compare groups with words such as 'more' or 'fewer'.