The big idea: Paper 1B doesn't just ask you to crunch numbers — it asks you to judge an experiment.
Three questions come up again and again
- Which variable must you control (keep the same) so the test is fair?
- Why repeat a reading and average it? To cut down random uncertainty.
- Is a method any good — and how would you improve it?
Two words to get right first: Control variable — a quantity you deliberately keep constant so it can't affect the result.
Anomaly — a reading that is clearly out of line with the others (a mistake), so you leave it out before averaging.
Why repeats + averaging help
- Random uncertainty scatters readings up and down by chance (reaction time, last-digit estimation).
- Averaging several repeats lets the high and low scatter cancel out, so the mean is more reliable.
- Spotting an anomaly and discarding it stops one bad reading from dragging the mean off.
- Repeats do not fix a systematic error (a zero-offset, a mis-calibrated meter) — that shifts every reading the same way.
Random uncertainty
- Scatters readings randomly up and down
- Caused by chance: reaction time, reading the last digit
- Reduced by repeating and averaging
Systematic error
- Shifts every reading the same way
- Caused by a fault: zero-offset, mis-calibration, parallax done the same way each time
- Not reduced by averaging — fix the instrument or method
How this is tested: Paper 1B almost always has a short 'suggest an improvement' or 'state the controlled variable' part worth 1–2 marks.
Typical asks: name the variable to keep constant · explain why a length was measured in several places · why taking one reading per setting is poor · suggest a better instrument or repeat scheme.
A student measures how far an air-gun pellet sinks into a block of modelling clay for different firing pressures, to test how depth d depends on pressure p. They take one depth reading at each pressure. (a) State one variable they must control. (b) Suggest why taking only one reading per pressure is a poor method.
Model answer plan
See the answer broken into clear points, with guidance on how each point earns marks.
Free preview
This is the free notes preview
You're reading the free notes. Aimnova Pro unlocks the full study experience — and you can try it with your first topic free to keep:
- FlashcardsLock in vocabulary and key terms with spaced repetition.
- Practice questionsAnswer exam-style questions and get instant AI marking.
- Mock exams & past-paper vaultSit full mocks and see exactly how examiners award marks.
- Personalised study planA daily plan built around your exam date and weak areas.
A systematic error shifts every reading by the same amount or in the same proportion. On a graph it shows up as an intercept where the law predicts none.
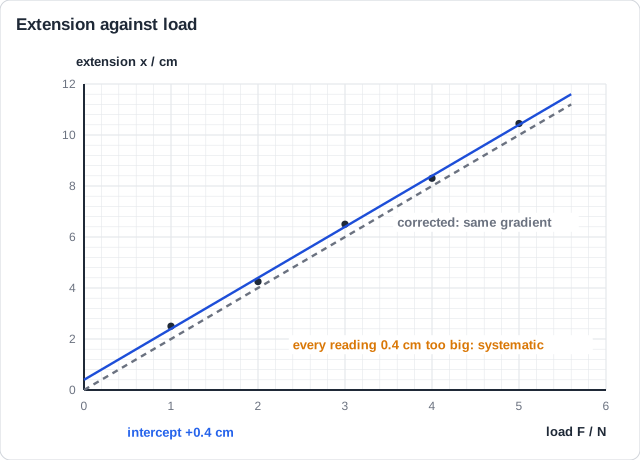
Accurate or precise?: Precise: readings close together (small uncertainty). Accurate: close to the accepted value.
Compare: if the accepted value lies inside value ± uncertainty, the result is consistent with it (accurate). If it lies outside, the method has a systematic error or a flawed assumption.
Assumptions and limitations: Every method rests on assumptions: friction or air resistance negligible, a small angle, a load shared evenly, no heat lost. Say which assumption a step needs and how the set-up makes it true (a long thread keeps the angle small).
Realistic improvements
- A wider range of the independent variable, and more values in it
- Evenly spaced readings (choose the intervals, not the clock)
- Repeats to reduce random error; a calibrated or zeroed instrument for systematic error
- A sensor or light gate instead of hand timing
Memorize terms 3x faster
Smart flashcards show you cards right before you forget them. Perfect for definitions and key concepts.
A separate skill — checking units: Dimensional analysis means balancing the fundamental SI units on both sides of an equation. The four you need are kg (mass), m (length), s (time) and A (current).
Use it two ways
- Find an unknown power in a relationship.
- State the units of a constant read off a gradient.
The one rule: Whatever units are on the left must equal the units on the right.
Match the power of each base unit (the kg's, the m's, the s's) separately — that gives you one equation per base unit.
| Quantity | Symbol | Fundamental SI units |
|---|---|---|
| force | F | kg m s⁻² |
| energy / work | E | kg m² s⁻² |
| pressure | p | kg m⁻¹ s⁻² |
| speed | v | m s⁻¹ |
| charge | q | A s |
A Paper-1B graph: depth d against root-pressure is a straight line through the origin, so d = k·sqrt(p). The gradient is the constant k — and we can work out its units.
Interactive diagram
Explore the labelled diagram, charts and maps for this topic in full study mode.
Here is the headline skill: balancing units to find unknown exponents.
The depth d (in metres) that a pellet sinks is modelled as d = k·pˣ, where p is the pressure (units kg m⁻¹ s⁻²) and k is a constant with SI units m¹·⁵ kg⁻⁰·⁵ s. Use dimensional analysis to find the exponent x.
Model answer plan
See the answer broken into clear points, with guidance on how each point earns marks.
How this is tested: A common Paper-1B pattern: you plot data, draw a best-fit line, read a gradient, and then state the units of the constant that gradient represents — pure dimensional analysis.
Classic trap: Giving the gradient a number but no units, or guessing the units instead of dividing the y-axis units by the x-axis units.
Units of a gradient: A gradient is rise ÷ run, so its units are the y-axis units ÷ the x-axis units.
Write both axis units, divide, simplify — that is the constant's unit.
Extension x (cm) against applied force F (N): a straight line through the origin. The gradient is a constant; the steeper and shallower lines through the error bars show where its uncertainty comes from.
Interactive diagram
Explore the labelled diagram, charts and maps for this topic in full study mode.
A spring's extension x (in metres) is plotted against the applied force F (in newtons). The points lie on a straight line through the origin, so x = k·F. (a) State the SI units of the gradient constant k. (b) The student measured each extension only once — suggest one improvement to make the gradient more reliable.
Model answer plan
See the answer broken into clear points, with guidance on how each point earns marks.